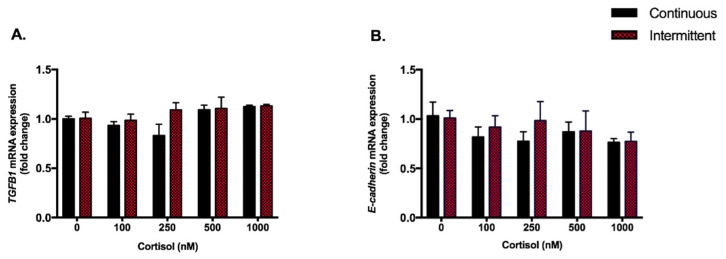
Figure A3.
RT-qPCR. TGFB1 (A) and E-cadherin (B) mRNA in SGHPL-4 cells treated with continuous or intermittent exposure to cortisol (100, 250, 500, 1000 nM), and vehicle (0 nM) in the medium. Data were compared by two-way ANOVA with Tukey multiple comparisons test. Data are presented as mean ± SEM. TGFB1, Transforming growth factor β1. Cell treatment was repeated three times.

