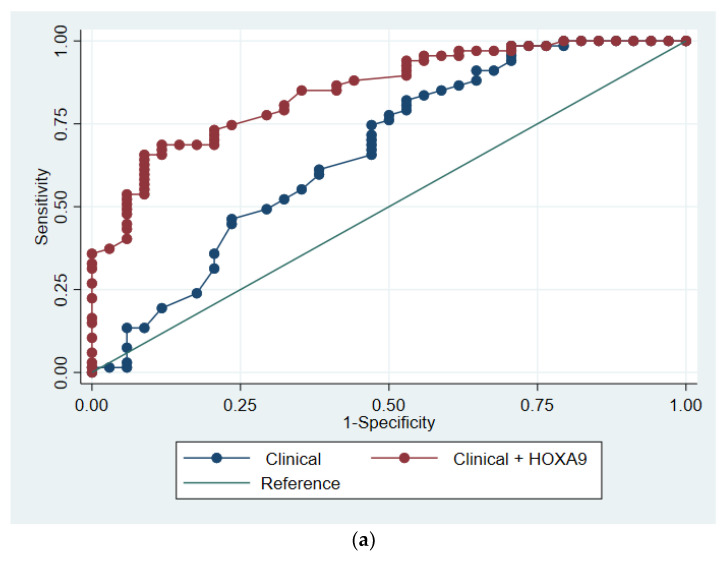
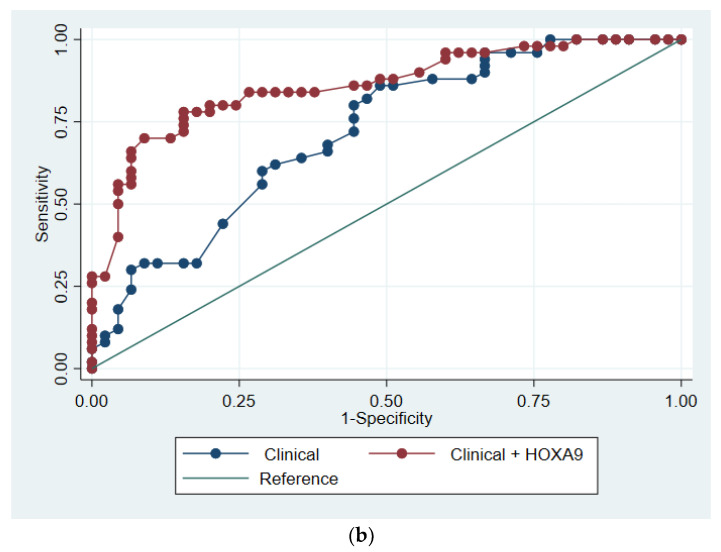
Figure 2.
ROC analysis of the multiple logistic regression models based on clinical variables with and without methylated HOXA9. Receiver operating characteristics (ROC) curves illustrating the diagnostic performance of the two logistic regression models in (a) the Discovery cohort and (b) the Validation cohort. The blue line represents the multiple logistic regression model based on clinical variables, while the red line represents the model including methylated HOXA9 status.


