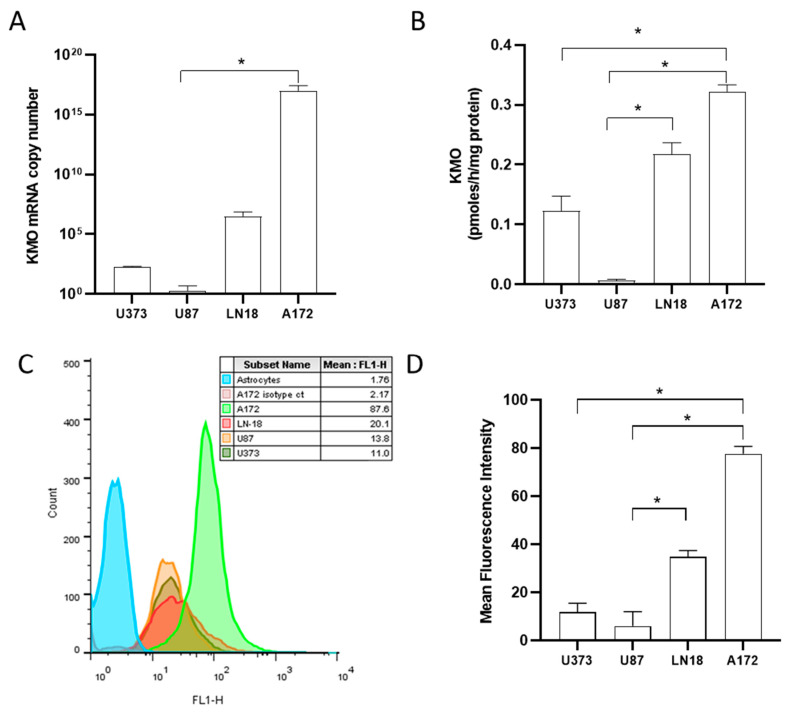
Figure 1.
Kynurenine monooxygenase expression and activity in GBM cell lines. Quantification of KMO mRNA copies (A) and KMO activity (B) in GBM cell lines A172, LN-18, U87, and U373. Representative histogram (C) and KMO protein expression in GBM cell lines (D). Data in (A,B,D) are the mean ± SEM (n = 3–5); * p < 0.05 based on the Kruskal–Wallis test, with Dunn’s test for pairwise comparisons.

