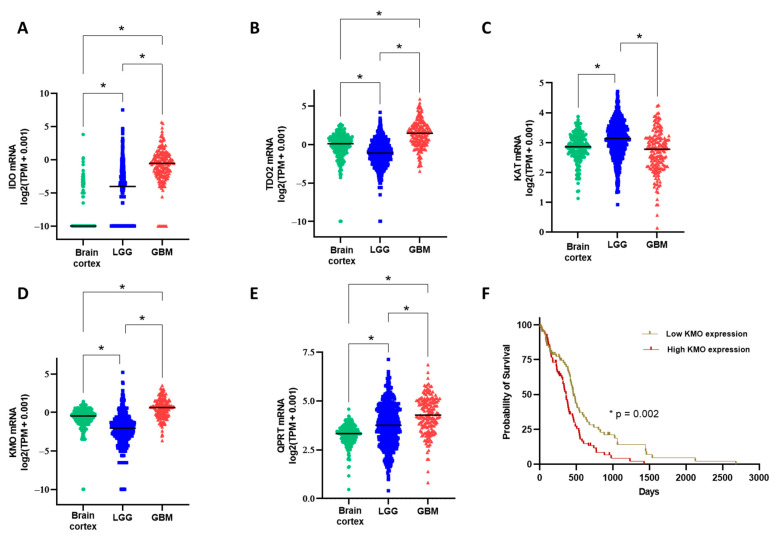
Figure 5.
Comparison of gene expression levels (transcripts per million, TPM) on KP enzymes among three groups: brain cortex (non-diseased, GTEx project), low-grade glioma (TCGA program), and GBM (TCGA program). (A–E) mRNA expression of indoleamine dioxygenase (IDO), tryptophan dioxygenase (TDO), kynurenine aminotransferase II (KAT2), kynurenine monooxygenase (KMO), and quinolinic acid phosphoribosyl transferase (QPRT). * p < 0.001 based on the Kruskal–Wallis test, with Dunn’s test for pairwise comparisons. (F) Kaplan–Meier plot using the data from the GBM group; patients were divided into two groups based on the median KMO expression, and the p-value is based on the log-rank test.

