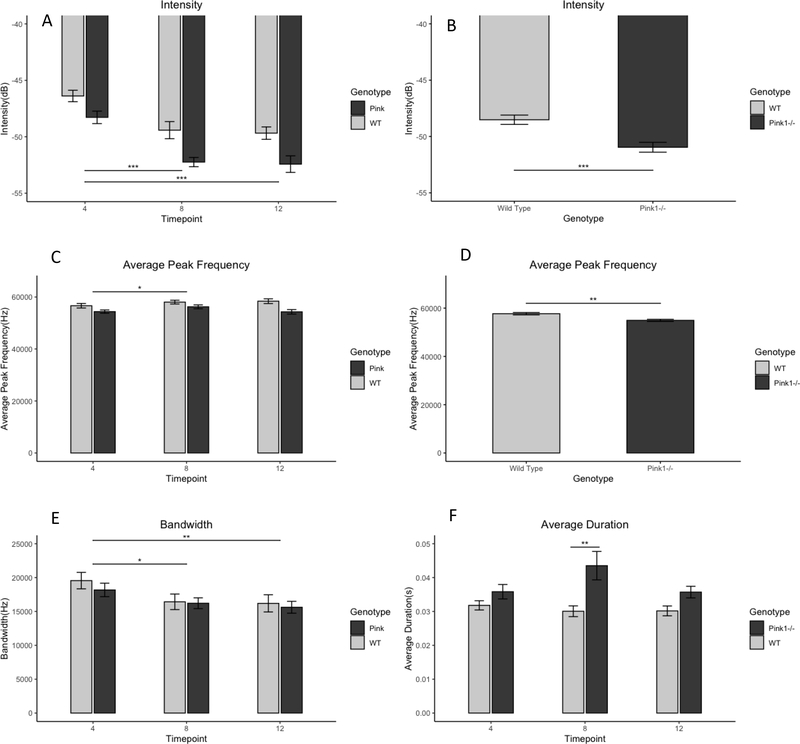
Figure 3.
Ultrasonic Vocalization. A: Average intensity of calls by genotype and timepoint; B: Average intensity with data collapsed across time to show main effect for genotype. Less-negative value indicates louder call. C: Average peak frequency; D: Average peak frequency data collapsed across time to show main effect for genotype. Pink1−/− calls were significantly lower than WT across timepoints; average peak frequency at 8 months was greater than at 4 months, regardless of genotype. E: Average bandwidth. Bandwidth was significantly smaller at 8 and 12 months than 4 months for both genotypes. F: Duration. Pink1−/− calls were significantly longer than WT calls at the 8-month timepoint only. dB: decibels. Hz: Hertz. * p<0.05. **p<0.01. ***p<0.001. Error bars indicate +/− SEM.

