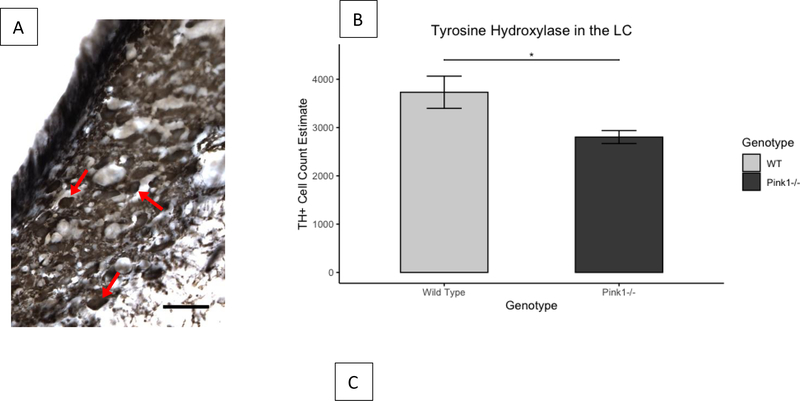
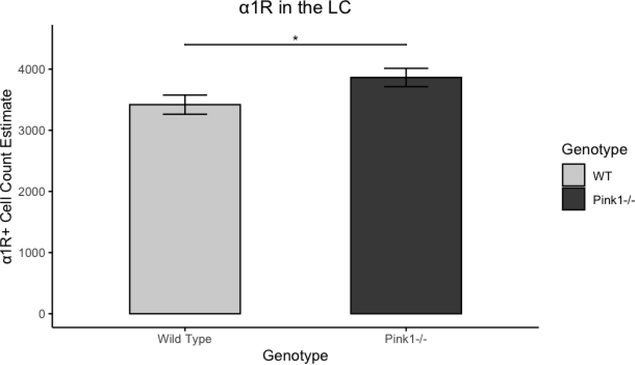
Figure 6.
Cell count estimates of tyrosine hydroxylase and α1R immunoreactivity in the locus coeruleus. A: Representative photomicrograph of TH immunoreactivity in the LC. 40x magnification, scale bar is 50μm, arrow points to immunoreactive cell. B: Cell count estimates for TH+ immunoreactivity. C: Cell count estimates for α1R immunoreactivity. *p<0.05. Light and dark gray bars indicate WT and Pink1−/−, respectively. TH+: positive staining for tyrosine hydroxylase immunoreactivity. α1R: α1 adrenoreceptor immunoreactivity. LC: locus coeruleus. Error bars indicate +/− SEM.


