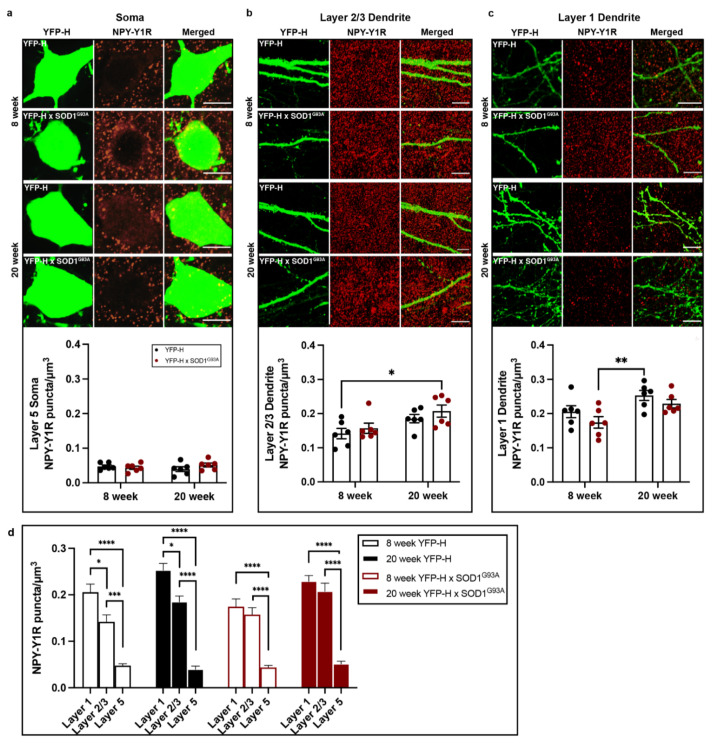
Figure 5.
Immunohistochemical investigation of NPY-Y1 receptor density on layer 5 upper motor neurons throughout disease progression in YFP-H::SOD1G93A (n = 6 per age group) and YFP-H mice (n = 6 per age group). (a–c) Immunohistochemical comparisons of NPY-Y1 receptors (red) localised to the cell soma (a) and distal apical dendrites in layers 2/3 (b) and 1 (c) of YFP-H- (green) positive upper motor neurons between YFP-H and YFP-H::SOD1G93A mice at 8 and 20 weeks of age. (d) Three-way ANOVA comparisons of NPY-Y1 receptor density between cortical layers of YFP-H and YFP-H::SOD1G93A mice at 8 and 20 weeks of age. Presented values represent the mean density for individual animals across a minimum of two brain slices. Bars represent the mean ± SEM. * p < 0.05, ** p < 0.01, *** p < 0.001, **** p < 0.0001. Scale bar = 10 µm.

