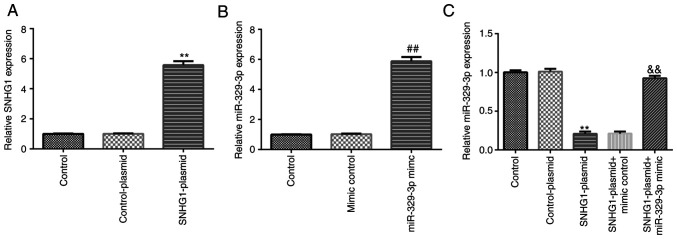
Figure 3.
Transfection efficiency of SNHG1-plasmid and miR-329-3p mimic in BV-2 cells. BV-2 cells were transfected with control-plasmid, SNHG1-plasmid, mimic control, miR-329-3p mimic, SNHG1-plasmid + mimic control, or SNHG1-plasmid + miR-329-3p mimic for 24 h. (A) Reverse transcription-quantitative PCR was performed to analyze the mRNA expression levels of SNHG1 in BV-2 cells following transfection with control-plasmid or SNHG1-plasmid. (B) Reverse transcription-quantitative PCR was performed to analyze the expression levels of miR-329-3p in BV-2 cells following transfection with mimic control or miR-329-3p mimic. (C) Reverse transcription-quantitative PCR was performed to analyze the expression levels of miR-329-3p in BV-2 cells transfected with control-plasmid, SNHG1-plasmid, SNHG1-plasmid + mimic control, or SNHG1-plasmid + miR-329-3p mimic. **P<0.01 vs. control-plasmid; ##P<0.01 vs. mimic control; &&P<0.01 vs. SNHG1-plasmid + mimic control. SNHG1, small nucleolar RNA host gene 1; miR, microRNA.

