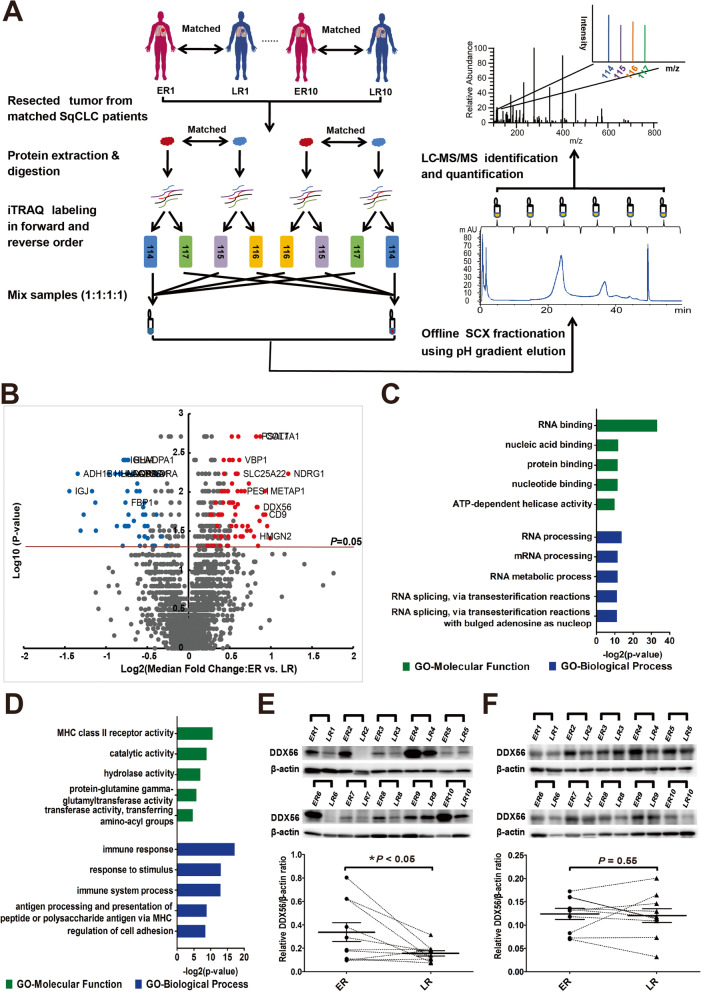
Fig. 1.
Identification of differentially-expressed proteins in primary squamous cell lung cancer (SqCLC) tissues of patients exhibiting early recurrence (ER) versus late recurrence (LR). a Experimental scheme of quantitative proteomic analysis. SqCLC tumor sample of patient with early recurrence (within 10 months) following surgery was paired with a SqCLC tumor sample of a patient with late recurrence (> 30 months) based on similar clinical and pathological features. After tissue lysis and tryptic digestion, each pair of peptide samples were labeled with iTRAQ reagents twice in two different orders (forward and reverse), and were mixed in a ratio of 1:1:1:1. Each mixed iTRAQ-labeled proteomic sample was fractionated into 6 fractions by SCX chromatography using a pH gradient elution, and then analyzed by LC–MS/MS. b Volcano plot constructed using median fold-change values and p-values to compare protein expression changes between ER and matched LR patients. Red dots represent significantly upregulated proteins and blue dots represent downregulated proteins (> 1.5-fold change in at least 4 sample sets and P < 0.05). The horizontal line represents a P value cut off < 0.05. P values were calculated using two-sided one sample Wilcoxon signed rank test. c and d Gene ontology (GO) classification of the 71 upregulated genes (c) and 60 downregulated genes (d) identified by proteomic analysis. Top 5 enriched GO terms of each category are shown. Green bars represent molecular function terms; blue bars represent biological process terms. The horizontal axis represents the –log2 (p-value). P < 0.05 was used as the threshold for selecting significant GO categories. e and f Western blots were performed to confirm altered DDX56 protein levels in tumor tissues as identified by mass spectrometry analysis, and to further analyze DDX56 protein levels in corresponding adjacent normal lung tissues from the same ER and matched LR patients. e Western blot analysis of DDX56 in tumor tissues from paired ER or LR SqCLC patients in cohort 1. Band intensity of DDX56 for the paired ER or LR tumor tissue samples is shown as quantified by densitometry and normalized to β-actin. f Western blot analyses of DDX56 in adjacent normal tissues from patients in cohort 1. Band intensity of DDX56 for the paired ER or LR patient adjacent normal tissue samples as shown in e quantified by densitometry and normalized to β-actin. Horizontal bars represent the median value with standard error of the mean. P value is determined by two-sided paired Wilcoxon signed-rank test. * P < 0.05

