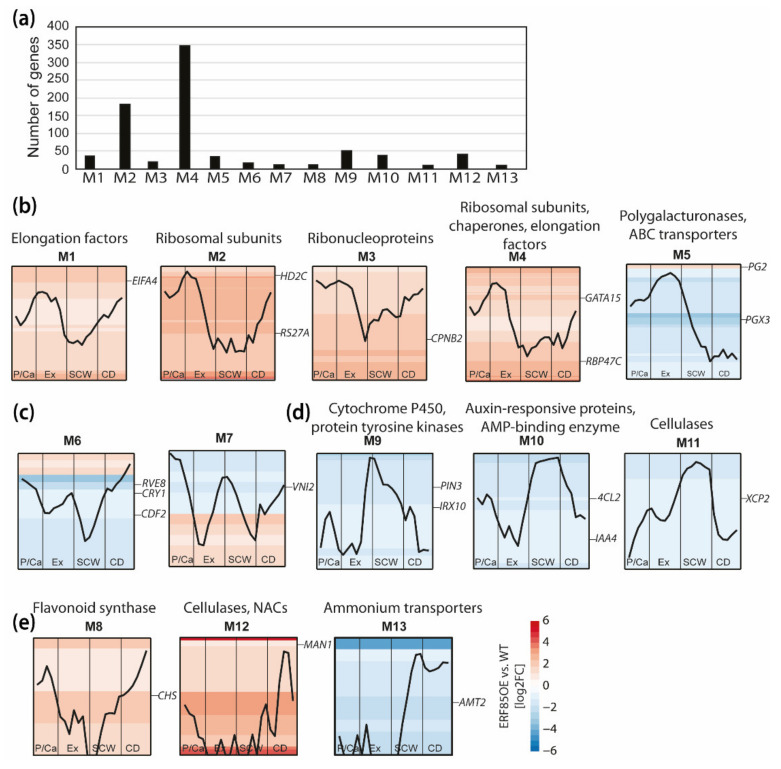
Figure 5.
Ectopic expression of PtERF85 induced expression of genes related to translation, while suppressing expression of SCW-related genes. (a) Genes with similar expression profiles during stem development were categorized into 13 gene modules (M1–M13) based on the AspWood co-expression network [3]. The size of each gene module is given in the histogram. (b) Gene modules with highest expression during xylem cell expansion. A representative gene, defined as the gene with the highest level of expression, was chosen to illustrate the expression profile of genes in each module (Table S7). Enriched PFAM terms (p-value < 0.05) are listed above each module (Table S6). Background heatmaps indicate gene expression (log2FC) in ERF85OE compared to WT for the genes in the module (each row represents a gene). (c) Gene modules with the highest expression levels in the transition phase of primary cell wall to SCW formation. (d) Gene modules with the highest expression level during SCW formation. (e) Gene modules with the highest expression level in the zone of cell death. P/Ca = phloem/cambium; Ex = expanding xylem; SCW = secondary cell wall formation, CD = cell death; EIFA4-2 (Potri.001G197900); HD2C (Potri.004G188800); RS27A (Potri.003G161200); CPNB2 (Potri.001G002500); GATA15 (Potri.008G213900); RBP47C (Potri.002G128100); PG2 (Potri.001G171900); PGX3 (Potri.008G100500); RVE8 (Potri.016G083900); CDF2 (Potri.004G121800); CRY1 (Potri.005G164700); VNI2 (Potri.017G063300); CHS (Potri.003G176700); PIN3 (Potri.010G112800); IRX10 (Potri.003G162000); 4CL2 (Potri.001G036900); IAA4 (Potri.010G078400); XCP2 (Potri.005G256000); MAN1 (Potri.001G266900); LBD4 (Potri.007G066700); AMT2 (Potri.019G000800).

