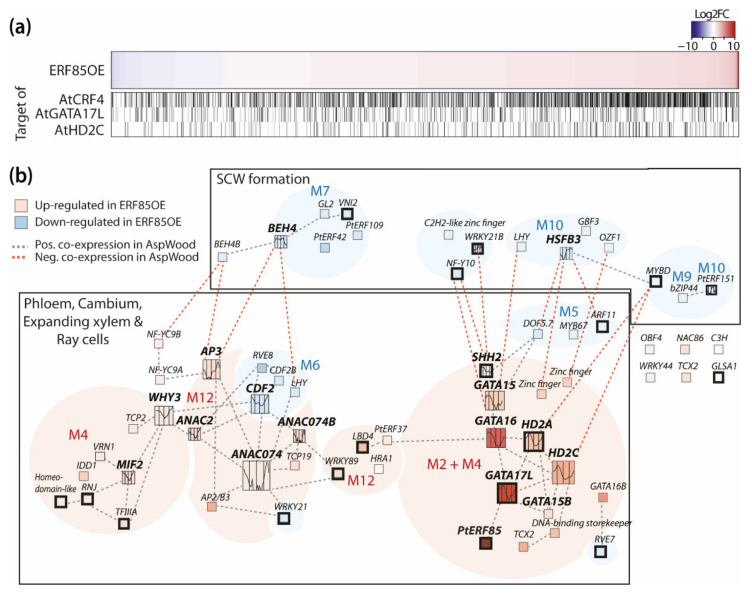
Figure 6.
Potential PtERF85-controlled gene regulatory networks during wood development. (a) Heatmap showing the gene expression of all DEGs in ERF85OE compared to WT. The graphs beneath the heatmap indicate homologs that were identified as direct targets of AtCRF4, AtGATA17L, and AtHD2C in Arabidopsis (Table S2; [35,37,38]). (b) Co-expression network of differentially expressed TFs in ERF85OE during wood development (Table S9). Thickened box lines indicate TFs for which homologs were identified as direct targets of AtCRF4 in Arabidopsis [37]. Background color represents gene expression induction (red) or suppression (blue) in ERF85OE lines compared to WT. TFs with at least four neighbors were highlighted by increased box size and expression profiles inside the box show their expression pattern during wood formation (obtained from the AspWood database [3]). Grey lines indicate positive co-expression between the TFs, red indicates negative co-expression. M = module (corresponding to Figure 5).

