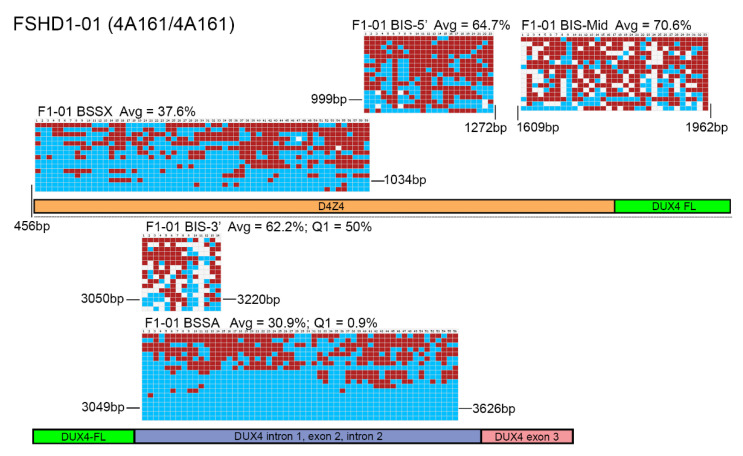
Figure 3.
BSS analysis comparison of FSHD1 epigenetic signatures. BS-converted DNA from a genetically confirmed FSHD1 subject (F1-01) was analyzed using the BSSA, BSSX, BIS-5′, BIS-Mid, and BIS-3′ assays. Each BS graphic representation is shown approximately where it aligns with each part of the 4q35 D4Z4 array including the D4Z4 (orange), DUX4-fl ORF (green), DUX4 Intron 1, Exon 2, Intron 2 (purple), and Exon 3 (pink), with exact location indicated by base pairs (bp) downstream from the KpnI site of the distal D4Z4 RU. Blue boxes indicate unmethylated CpGs, red boxes indicate methylated CpGs, and white boxes indicate no CpG where one is expected. Average methylation percentages are denoted “Avg” and have values of 37.6% for BSSX, 64.7% for BIS-5′, 70.6% for BIS-Mid, 62.2% for BIS-3′, and 30.9% for BSSA. This FSHD1 subject has a haplotype of 4A161/4A161. Therefore, the diagnostic methylation percentages for the first quartile (Q1) are included for BSSA (0.9%) and BIS-3′ (50%) for comparison.

