Fig. 6.
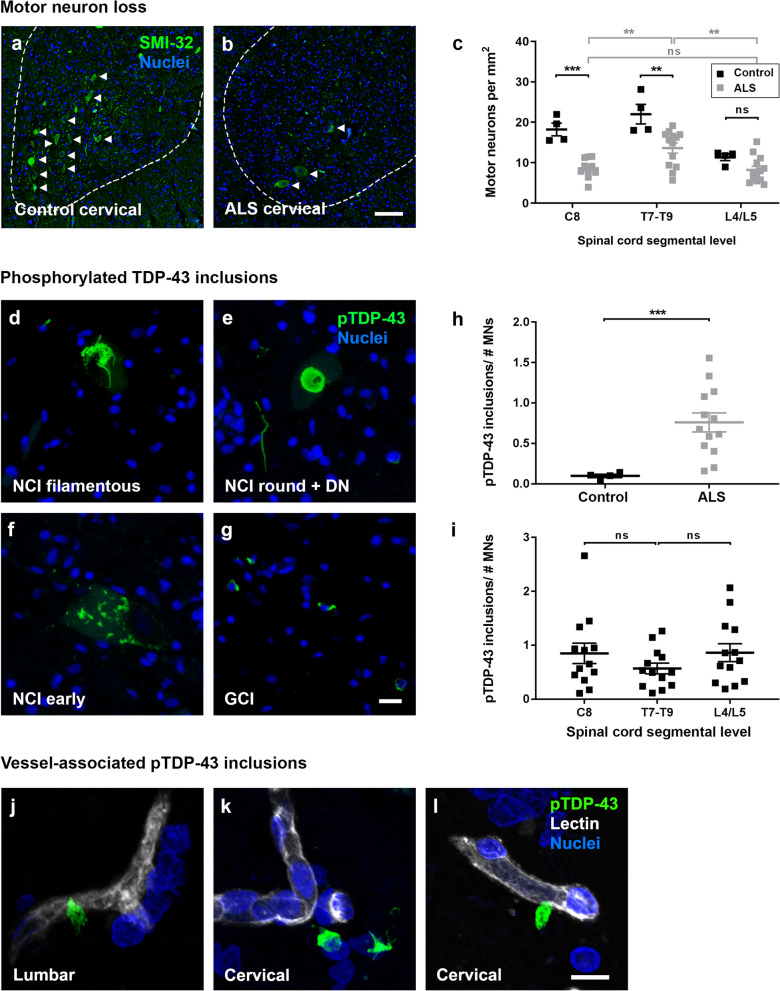
Motor neuron loss and pTDP-43 pathology along the spinal cord axis. Immunolabelling of spinal cord motor neurons with SMI-32 (green) and a Hoechst nuclear counterstain (blue) in control (a) and ALS (b) cervical spinal cord. Motor neuron numbers per area of anterior horn were manually quantified at individual segmental levels C8, T7-T9, and L4/L5 in control and ALS spinal cords (c). Immunohistochemical labelling of phosphorylated TDP-43 in ALS spinal cords; filamentous (d), round (e), or early (f) neuronal cytoplasmic inclusions (NCI) or dystrophic neurites (DN), and glial cytoplasmic inclusions (GCI) (g). Scale bars = 10 µm. Automated counting of pTDP-43 inclusions of 8 µm diameter or greater detected neuronal inclusions but rarely glial inclusions and normalized to the number of motor neurons averaged across cervical C8, thoracic T7-T9, and lumbar L4/L5 for control and ALS spinal cords (h). Phospho-TDP-43 inclusions/number of motor neurons were then investigated at individual segmental levels C8, T7-T9, and L4/L5 for ALS spinal cords (i). All data shown as mean ± SD, control n = 4, ALS n = 13, with statistical significance determined using two-way ANOVA with Tukey’s post-test (c, i). or student’s t test with Welch’s correction (h). ****p ≤ 0.0001; ***p ≤ 0.001; ns, not significant. Rare pTDP-43 inclusions (green) adjacent to or associated with lectin-positive blood vessels (white) in ALS lumbar and cervical spinal cord (j–l). Scale bars = 10 µm

