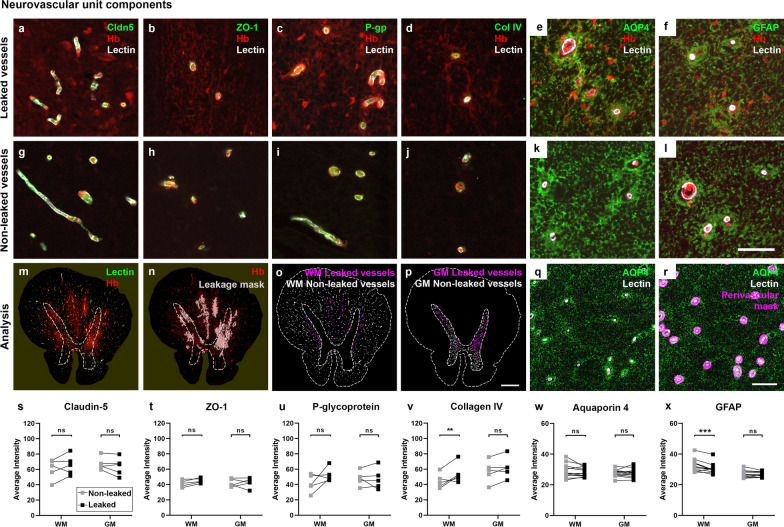
Fig. 7.
Neurovascular unit component expression in leaked versus non-leaked vessels along the spinal cord axis. Immunohistochemical labelling of neurovascular unit markers in ALS spinal cord (a–l); tight junctions claudin-5 (a, g) and ZO-1 (b, h), efflux pump P-glycoprotein (c, i), basement membrane marker collagen IV (d, j), and astrocyte markers aquaporin 4 (e, k) and GFAP (f, l), in spinal cord vessels with or without hemoglobin leakage. Scale bar = 50 µm. Automated quantification of average intensity staining of neurovascular unit markers was carried out in all ALS cases (n = 13) or in a subset of ALS cases with high hemoglobin leakage (n = 5) in leaked and non-leaked areas of the white and gray matter of the spinal cord (m–r). Composite of original images showing anti-hemoglobin immunoreactivity (red) and lectin-positive vessels (green) (m) and overlays of hemoglobin leakage analysis output (white, partly transparent) over anti-hemoglobin (red) (n). Segmentation of vessels inside (magenta) or outside (white) areas of hemoglobin leakage in the white matter (o) or gray matter (p). Dashed lines show boundaries. Scale bar = 1 mm. Perivascular astrocyte endfeet staining (green) around lectin-positive vessels (white) in (q) was isolated using an automated mask of the glia limitans (r). Scale bar = 50 µm. The average intensities of marker staining were measured in leaked and non-leaked vessels of the gray and white matter (s–x). Data shown as mean ± SD (n = 5 or 13) with statistical significance determined with a two-way repeated-measures ANOVA with Sidak’s post-test. ns = not significant

