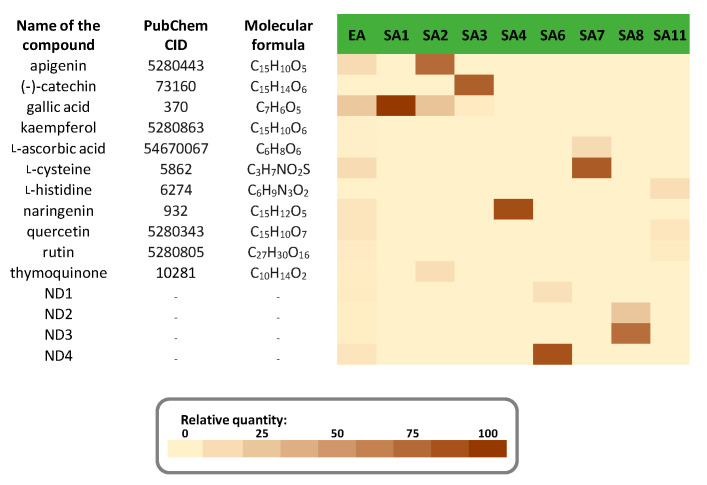
Figure 3.
Relative abundance (in % of total peak area) of the main components of the N. sativa seeds acetone extract (EA) and its resulting acetone fractions (SA1–SA11) determined by HPLC–DAD analysis. HPLC–DAD chromatograms are shown in Figure S2. UV spectra are shown in Figure S3. Values are given in Table S2.

