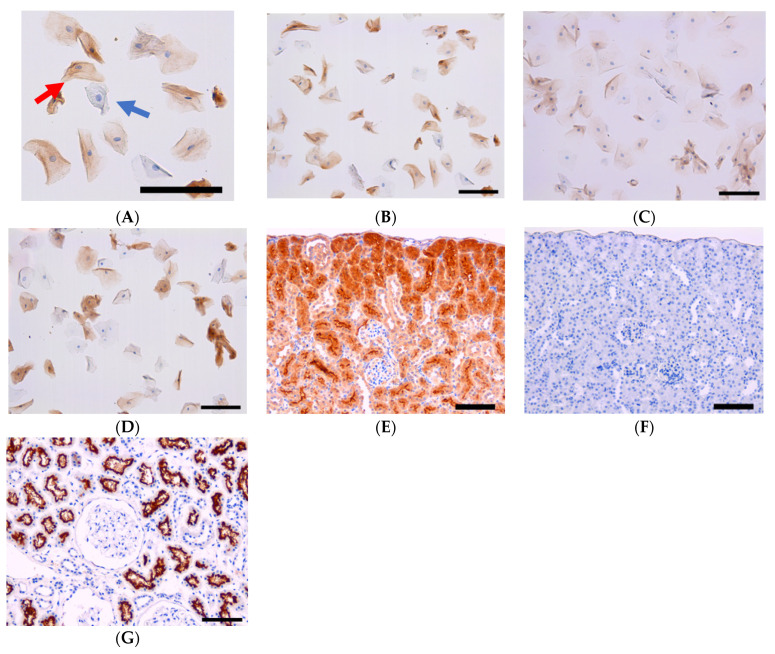
Figure 1.
(A) Typical case of ACE2-positive and -negative cells. Blue arrow: ACE2-negative cell. Red arrow: ACE2-positive cell. Bar =100 μm. (B) Representative ACE2 expression in tongue cells (bar = 100 μm). (C) Representative ACE2 expression in palate cells (bar = 100 μm). (D) Representative ACE2 expression in gingival sulcus cells (bar = 100 μm). (E) Positive control using mouse kidney. (bar = 100 μm). (F) Negative control using mouse kidney without the 1st antibody (bar = 100 μm). (G) Positive control using human kidney sample (bar = 100 μm).

