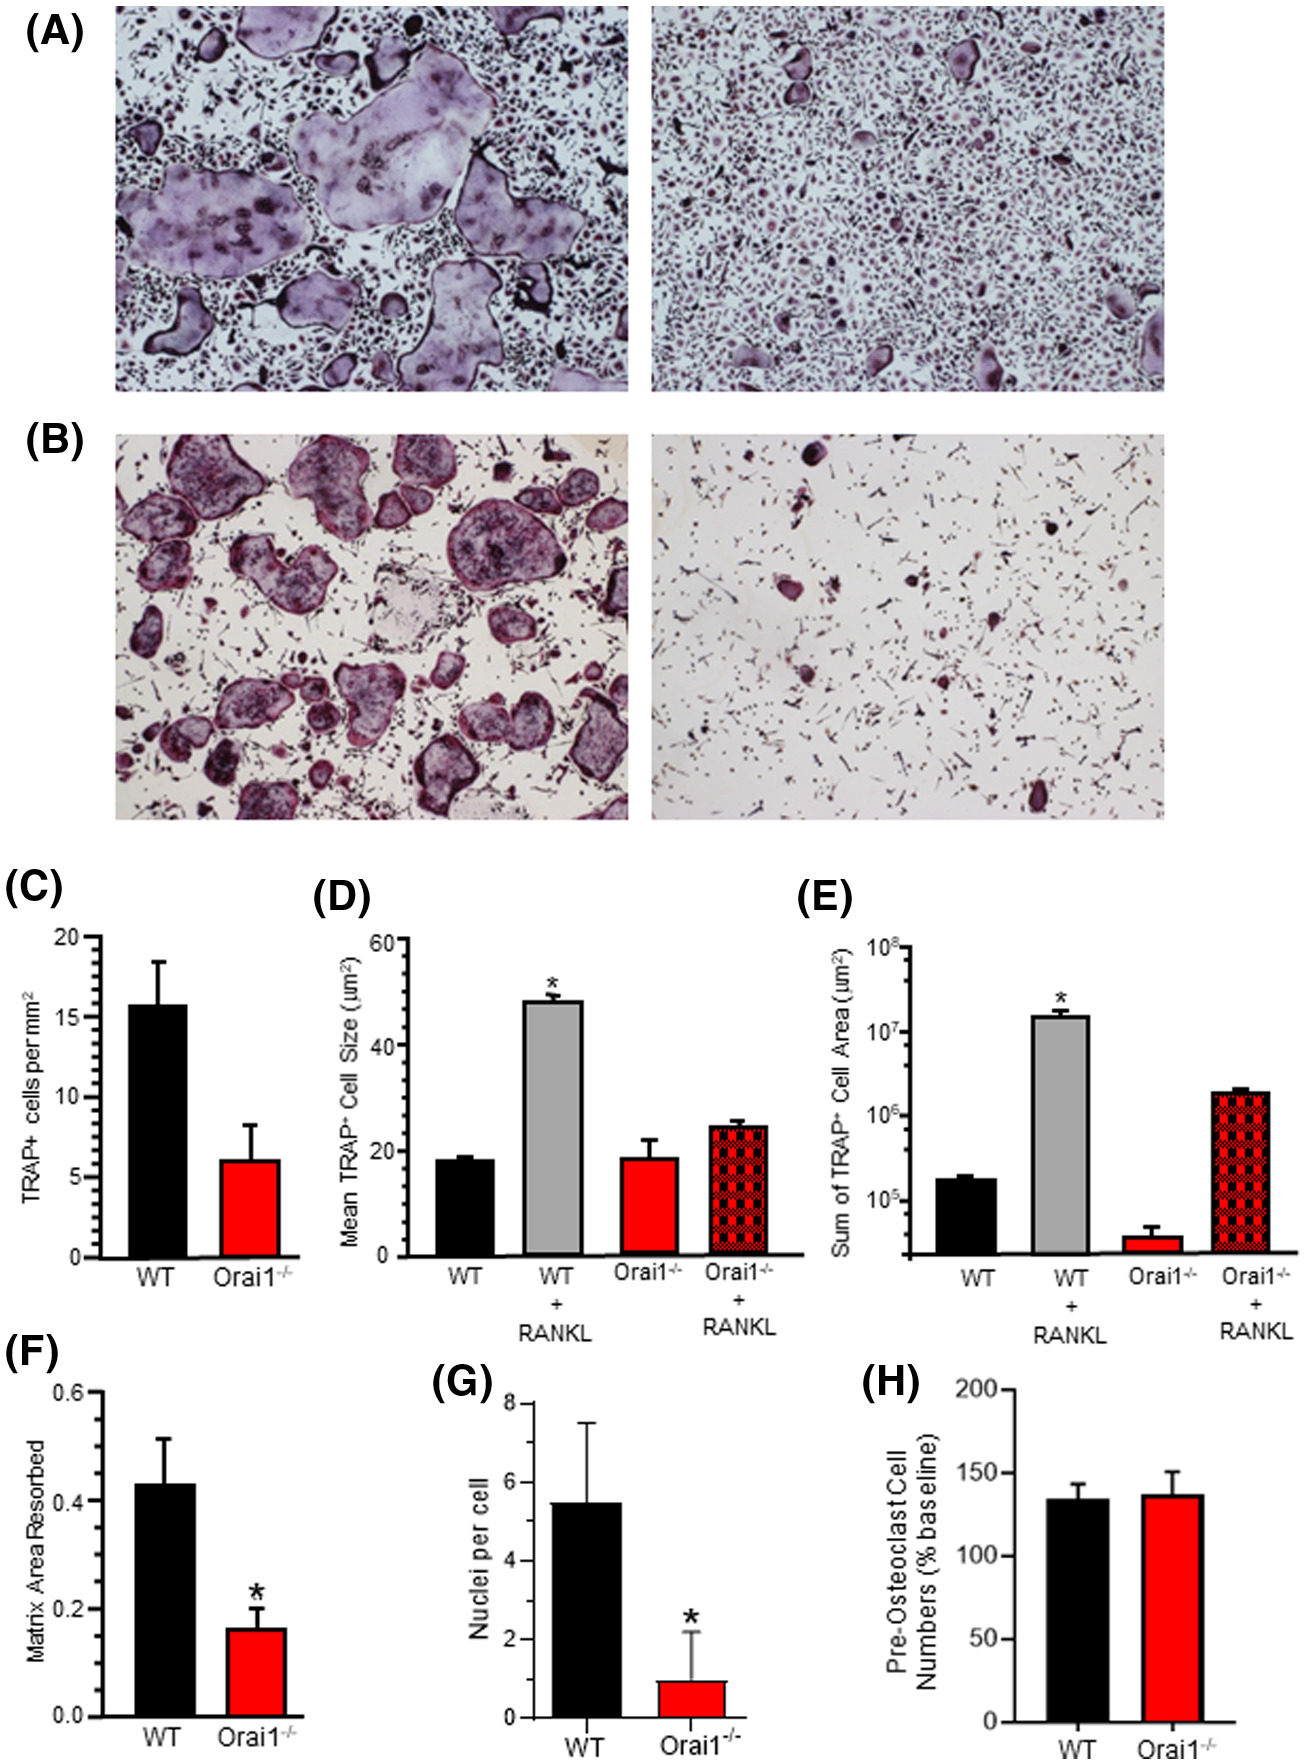
FIGURE 4.

In vitro osteoclastogenesis from bone marrow of Orai1fl/fl-LysMcre and WT mice. A, Histomorphology of TRAP+ cells differentiated in vitro in RANKL plus m-CSF. Representative results from independent experiments using cells from three pairs of Orai1fl/fl-LysMcre and WT mice. B, Histomorphology of TRAP+ cells differentiated in vitro in RANKL plus CSF-1 on mineralized matrix. Results are representative of independent experiments using cells from three pairs of Orai1fl/fl-LysMcre and WT mice. C, TRAP+ cells per mm2 in cultures described in A above. D, Mean TRAP+ cell size in cultures described in A above. Wild type plus RANKL is significantly greater than all other groups. E, Mean TRAP+ cell area in cultures described in A above. Wild type plus RANKL is significantly greater than all other groups. F, Resorption of plate matrix coating by bone marrow TRAP+ cells from Orai−/− and WT mice differentiated in vivo. Data show the percent of matrix area resorbed, n = 4, mean ± SD P < .001. G, Nuclei per cell in cultures. Marrow cell cultures were stimulated with m-CSF and RANKL for one week and then TRAP stained. The number of nuclei per TRAP+ cell was counted for Wild Type or Orai1fl/fl-LysMcre mononuclear cells. The average number of nuclei per cell in wild-type cells was approximately 5.5 and in the Orai1−/− the average was approximately 1 per cell. These numbers are statistically different (n = 48, mean ± SEM, P < .0001). H, Evaluation of cell numbers in marrow cultures from control and Orai1 conditional knock-out mice. Cell numbers (per well of 96-well plate) evaluated by Alamar blue assay; shown are cell numbers after 24 hours as percentage of baseline (t = 0) cell numbers. Results (mean ± SD, N = 4) are representative of 3 independent experiments; no significant differences were detected
