FIGURE 5.

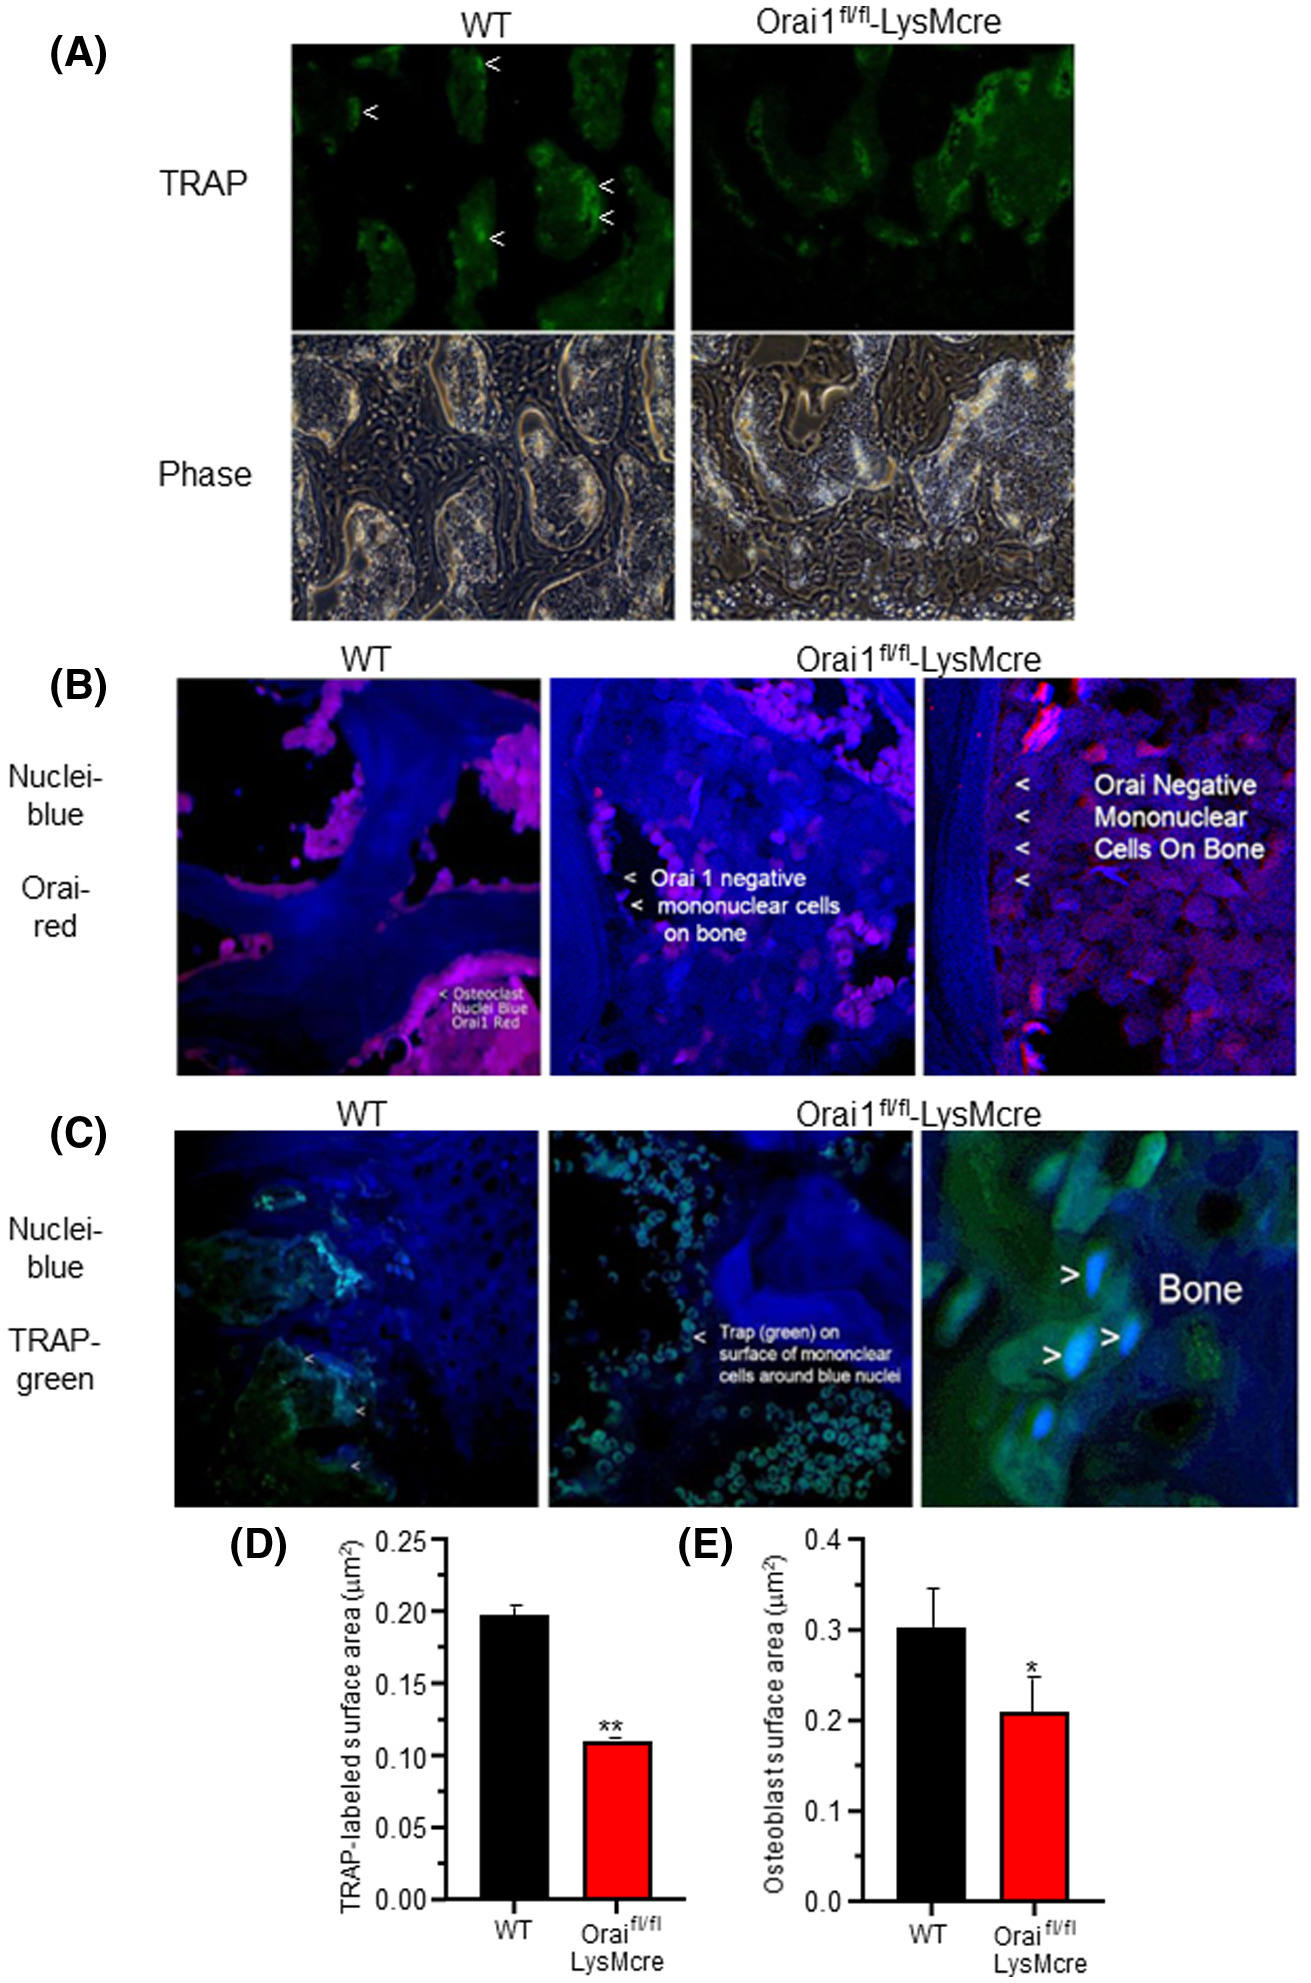
Orai1−/− cells express osteoclast markers but do not multinucleate: Labeling of Orai1 and TRAP in WT and conditional Orai1−/− cells. In each case, WT is shown on the left and the LysM2 cre/Orai1-floxed bone on the right. A, Moderate magnification (500 μm across) sections of bone labeled for TRAP (top) and in phase (bottom) showing large cells (osteoclasts) in the WT (marked with <) and small cells (mononuclear cells) in the conditional knockout. Higher powers are shown below for clarity. B, Higher magnification (150 μm) sections labeled for Orai1 (red) and nuclei (blue) showing multinucleated Orai1 expressing cells in the wild type (left) and Orai1−/− mononuclear cells attached to bone in the conditional knockout (middle) with a high power (75 μm) section for clarity (far right). C, TRAP (green) and nucleus (blue) labeled sections. A 200 μm field of the wild type (WT, left) shows multinucleated osteoclasts. A 100 μm field of the conditional knockout (Orai1−/−, middle) shows TRAP labeled mononuclear cells. A higher power section of the conditional knockout (25 μm) is shown for clarity (far right). D, The TRAP labeled surface area (Oc.S/BS equivalent) as a function of total bone surface was measured. The TRAP labeled surface was decreased in the conditional knockout (P < .01, n = 3). E, Osteoblast surface area (bone formation surface) (Ob.S/BS) estimated as cuboidal bone lining cell area. The difference was similar to the difference in TRAP labeled surface (P < .03, n = 3)
