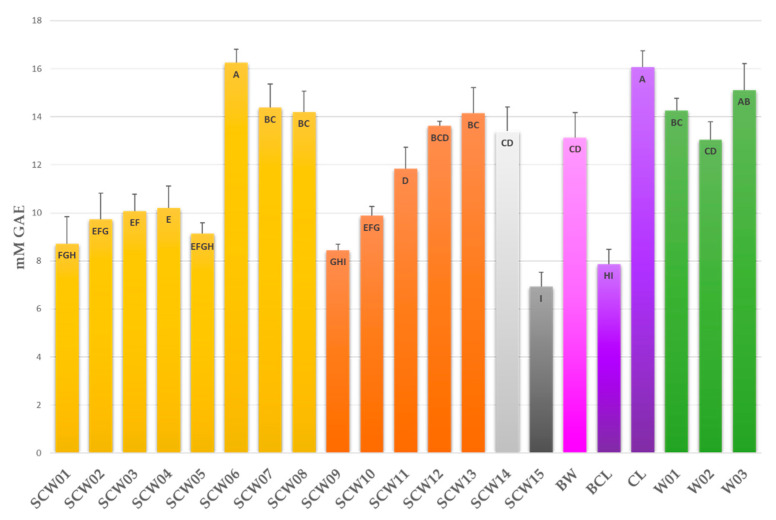
Figure 1.
Total phenol contents (TPC) of the samples measured using Folin–Ciocalteu’s reagent. Bars are coloured depending on the province (yellow = PU; orange = AN; light grey = MC; grey = AP) and on the type of the contained berry (yellow, orange, light grey, and grey = sour cherry; pink = blackthorn; violet = cherry; green = grape). Letters in the bars indicate homogeneous sub-classes resulting from Tukey’s post hoc multiple comparison test (p < 0.01).

