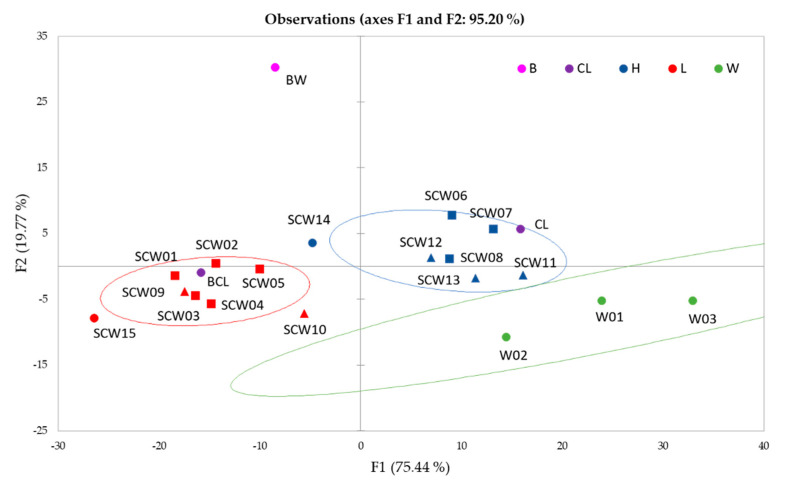
Figure 2.
Score plot for the first two factors resulted from the principal component analysis performed using the data set consisting of the first three coordinates (PC_FTIR) obtained from the analysis of the FT-IR spectra and of the UV-Vis spectra in HCl solutions. Points are coloured depending on the type of the contained berry and on the TAA level: (red = sour cherry with low TAA; blue = sour cherry with high TAA; pink = blackthorn; violet = cherry liquors; green = grape wine) and shaped depending on the production area (square = PU; triangle = AN).

