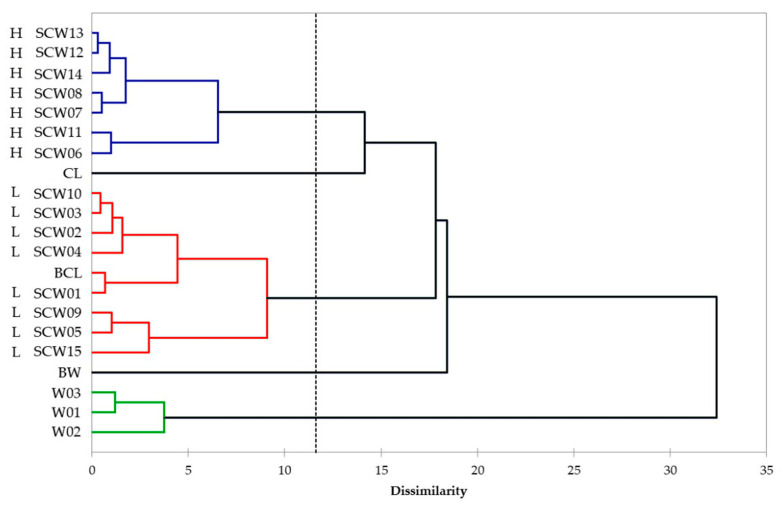
Figure 3.
Dendrogram obtained by cluster analysis performed using Ward’s method (Euclidean distance) on the data set incorporating all samples and six variables (PCs_FTIR and PCs_UVVis). SCW samples are described by their acronym and their antioxidant activity level as L and H. Groups are coloured depending on the type of beverage and on the TAA level: (red = sour cherry with low TAA; blue = sour cherry with high TAA; green = grape wine).

