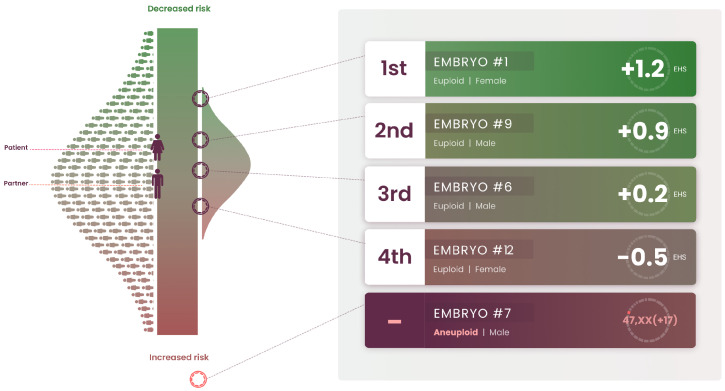
Figure 3.
Sample EHS report that indicates the scores of the mother, father, and five embryos. The bell-shaped distribution on the right helps to visualize the distribution of the EHS that would result if the mother and father had a large number of children (the distribution on the left is for the general population). The five embryos can be compared to this (potential) distribution. One of the embryos is aneuploid. The data in this report were drawn from an actual case.

