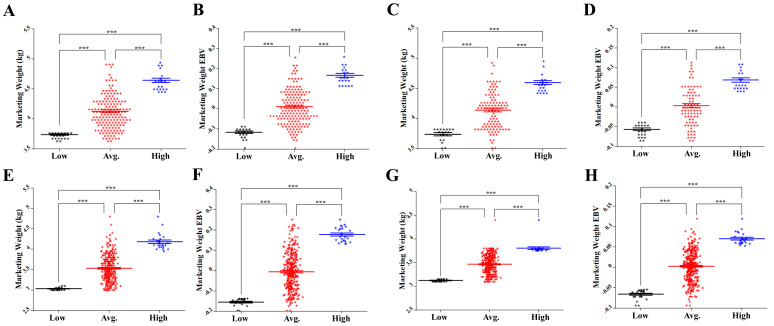
Figure 1.
Average marketing weight (MW) and estimated breeding values (EBVs) for males and females from P1 and P2: (A) MW and (B) EBV of P1 males, (C) MW and (D) EBV of P2 males, (E) MW and (F) EBV of P1 females, and (G) MW and (H) EBV of P2 females between high, average, and low EBV groups. The X axis represents low, average, and high groups of males and females from P1 and P2. The Y axis represents MW (kg) or EBV. The error bars represent the standard error of mean. * p < 0.05, ** p < 0.01 and *** p < 0.001.

