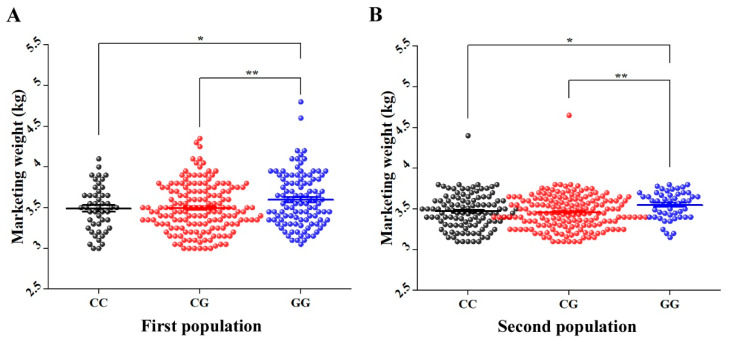
Figure 6.
Average MW (kg) of each genotype of SNP Record_1056 in females of (A) first population and (B) second population. The X axis represents different genotypes groups of Record_1056 in females of P1 and P2. The Y axis represents MW (kg). The error bars represent the standard error of mean. * p < 0.05 and ** p < 0.01.

