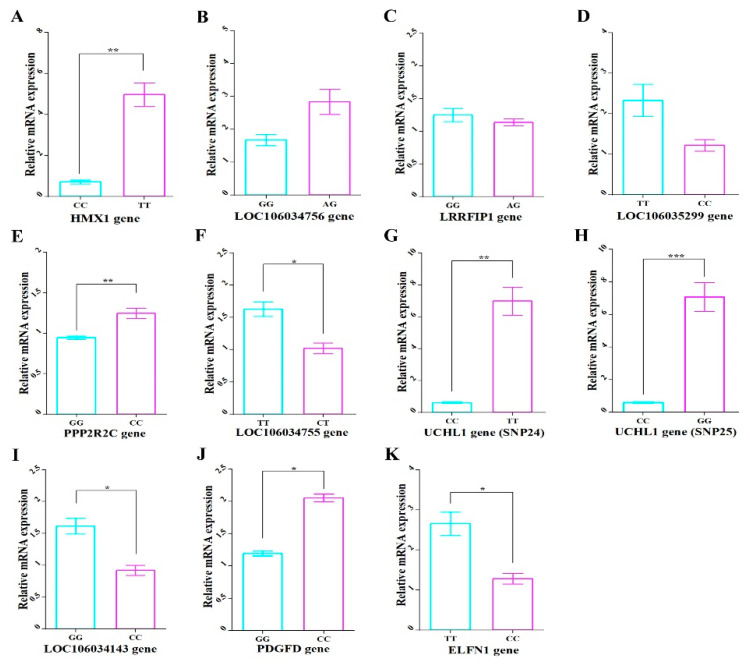
Figure 7.
The mRNA expression levels of the 10 genes harboring significant SNPs of the different genotypes of each SNP. The mRNA of (A) HMX1, (B) LOC106034756, (C) LRRFIP1, (D) LOC106035299, (E) PPP2R2C, (F) LOC106034755, (G) UCHL1 (Record_7099), (H) UCHL1 (Record_7097) (I) LOC106034143, (J) PDGFD, and (K) ELFN1 genes. The X axis represents different genotype groups of each gene in males of P2. The Y axis represents relative mRNA expression. The error bars represent the standard error of the mean. * p < 0.05, ** p < 0.01 and *** p < 0.001.

