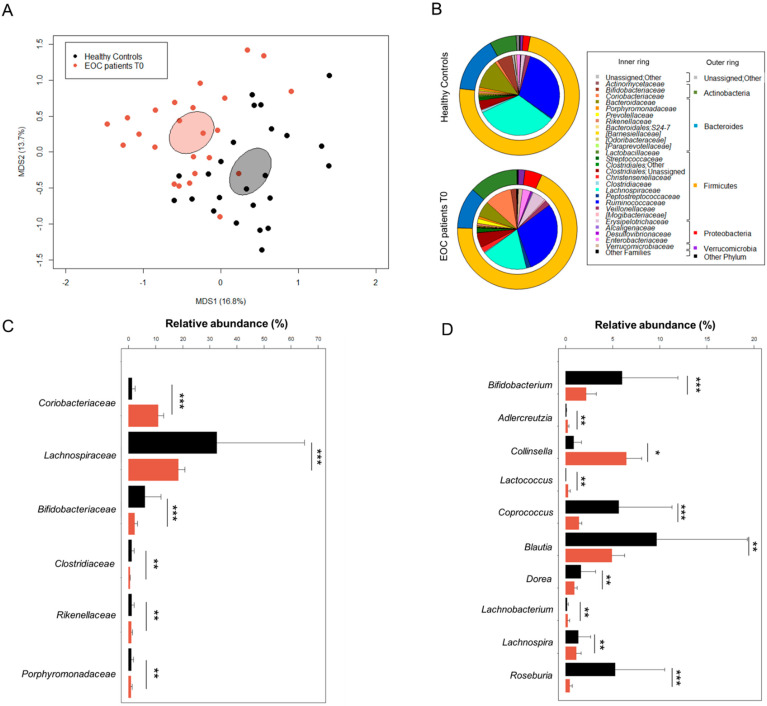
Figure 2.
The gut microbiota of EOC patients at diagnosis compared to healthy women. (A) PCoA based on Bray–Curtis dissimilarity between the genus-level profiles of 24 EOC patients and 24 healthy age/BMI-matched women living in the same geographical area (across Italy). A significant separation between groups was found (permutation test with pseudo-F ratio, p = 0.001). Ellipses include 95% confidence area based on the standard error of the weighted average of sample coordinates. (B) Pie charts showing the average relative abundance of major phyla (outer ring) and families (inner ring) in the gut microbiota of EOC patients and healthy women. Only taxa with relative abundance > 0.1% in at least one sample are shown. Relative abundance (mean ± SEM) of families (C) and genera (D) differentially represented between groups (Wilcoxon test, * for p ≤ 0.05; ** for p < 0.01; *** for p < 0.001). Only families with mean relative abundance > 0.5% in at least one of the two groups are shown.

