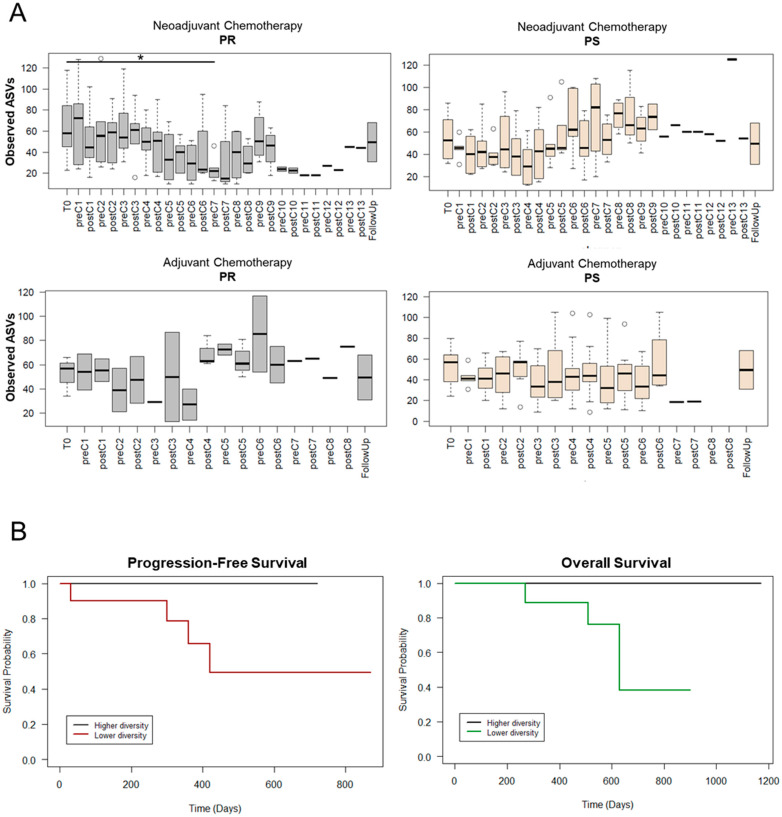
Figure 3.
Dynamics of alpha diversity in EOC patients during chemotherapy based on therapeutic response and association with survival. (A) Boxplots showing the distribution of the number of observed ASVs during neoadjuvant (top) or adjuvant (bottom) chemotherapy. Patients were stratified by response to therapy: PR, platinum-resistant (left) vs. PS, platinum-sensitive (right). C, chemotherapy cycle. Wilcoxon test, * for p ≤ 0.05. (B) Kaplan–Meier curves for progression-free survival (left) and overall survival (right) in the whole cohort. EOC patients were stratified by higher or lower number of observed ASVs (relative to median) at the preC7 (for neoadjuvant therapy) or the preC4 (for adjuvant therapy) time-points. Log-rank test, p ≤ 0.1.

