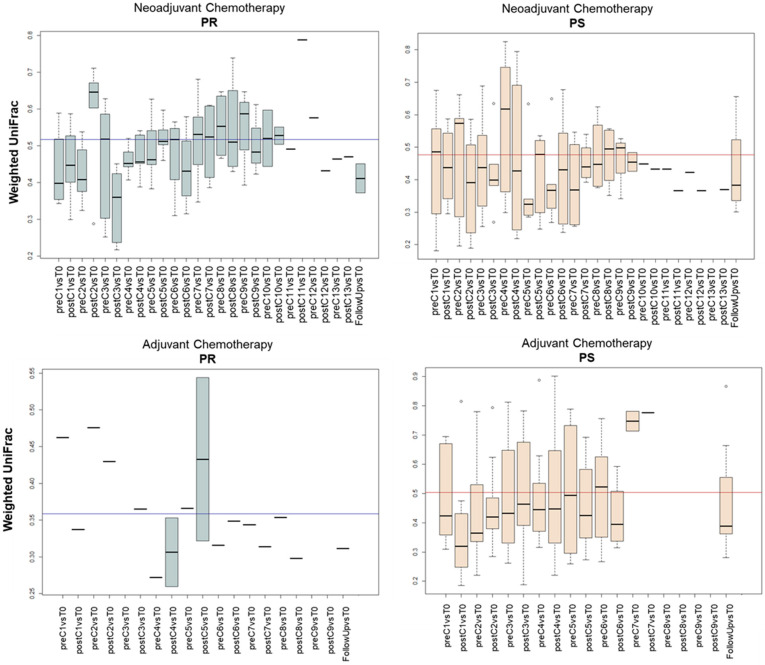
Figure 4.
Dynamics of beta diversity in EOC patients during chemotherapy based on therapeutic response. Boxplots show the distribution of weighted UniFrac distances between each time-point and the respective T0 for each EOC patient during neoadjuvant (top) or adjuvant (bottom) chemotherapy. Patients were stratified by response to therapy: PR, platinum-resistant (left) vs. PS, platinum-sensitive (right). The mean inter-patient variability at baseline (i.e., T0) is depicted as a line in each plot. C, chemotherapy cycle.

