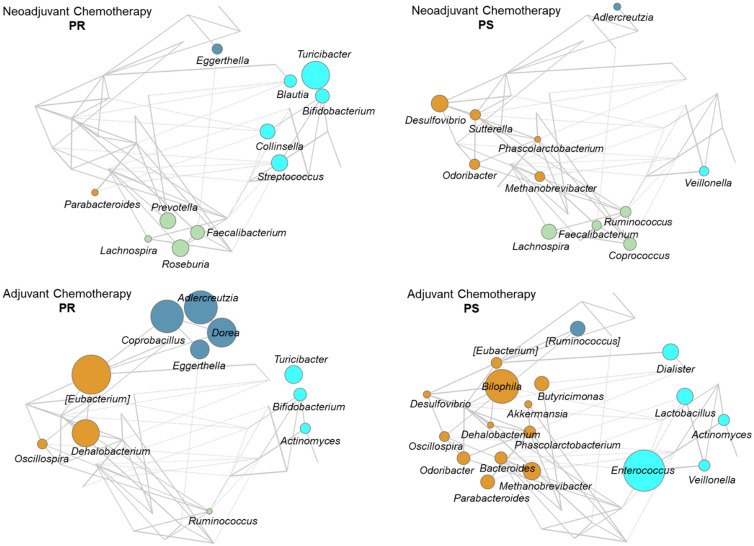
Figure 6.
Co-abundance groups in the gut microbiota of EOC patients receiving neoadjuvant or adjuvant chemotherapy. Wiggum plots show the pattern of variation of the four identified co-abundance groups (CAGs) in EOC patients receiving neoadjuvant (top) or adjuvant (bottom) chemotherapy. Patients were stratified by response to therapy: PR, platinum-resistant (left) vs. PS, platinum-sensitive (right). CAGs were named according to the most abundant genera and color coded as follows: Bacteroides (brown), Collinsella (cyan), [Ruminococcus] (dark blue), and Faecalibacterium (green). Each genus is depicted as a node whose size is proportional to the over-abundance relative to background. Positive and significant Kendall correlations between two or more genera are indicated with lines connecting the nodes (p < 0.05). The thickness of the lines was drawn in proportion to the correlation strength. See also Figure S8.

