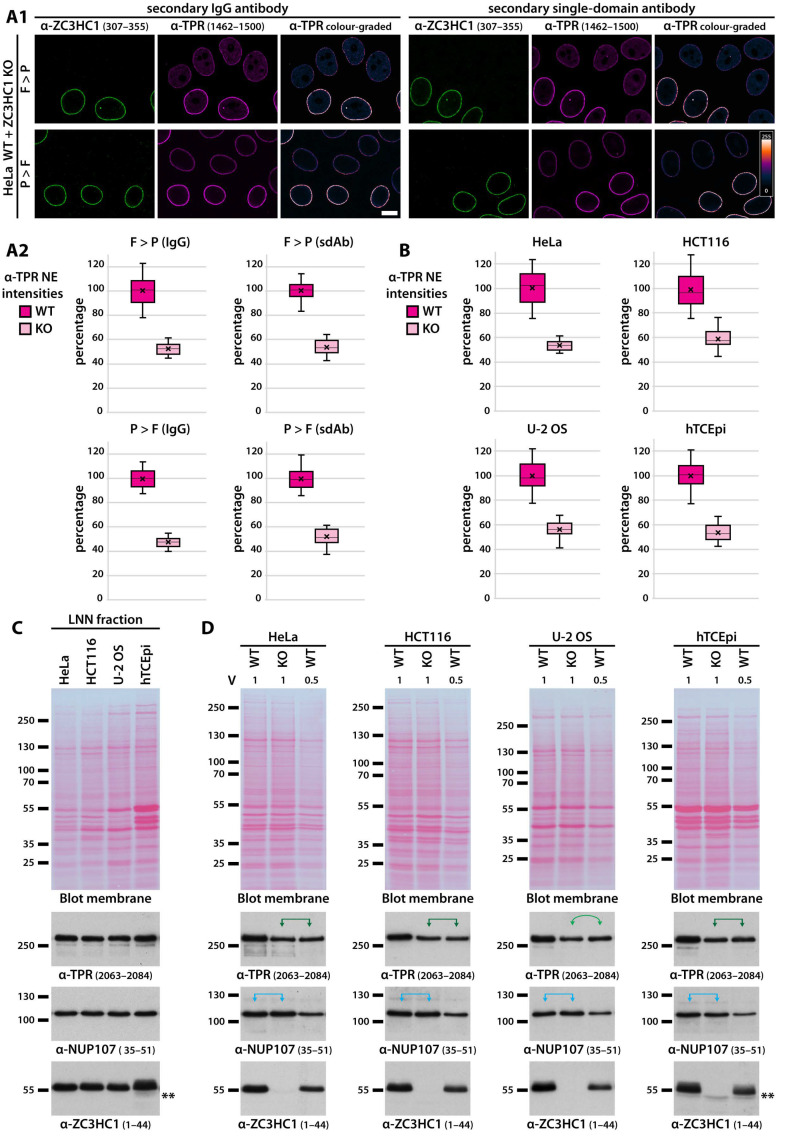
Figure 7.
Quantification of the relative amounts of NB-associated TPR in the WT and ZC3HC1 KO cells of four different cell lines reveals a reduction by about half upon the absence of ZC3HC1. (A) Quantification of the relative amounts of NB-associated TPR, in the HeLa WT and ZC3HC1 KO cells, following different procedures of specimen preparation and immunolabelling. (A1) IFM of mixed populations of HeLa WT and ZC3HC1 KO cells that had been co-cultured, cell cycle-synchronised, and harvested in G1. Cells were permeabilised with TX-100 either after (F > P) or before fixation (P > F), the latter resulting in the removal of the nuclear pool of soluble TPR. Labelling was with guinea pig antibodies for ZC3HC1, and a mAb for TPR, with the latter detected with either fluorophore-conjugated IgGs or a mouse IgG1-specific single-domain antibody (sdAb). The micrographs for TPR are again also shown colour-graded, displaying that signal intensity relationships between the WT and KO cells’ NEs were very similar within the different types of specimens. Bar, 10 µm. (A2) Quantification of signal yields for immunolabelled TPR at the NEs of HeLa WT and ZC3HC1 KO cells, following specimen preparation and immunolabelling as in (A1). Randomly chosen NE segments for quantifications via ImageJ were from essentially all labelled cells in equatorial view within randomly chosen images of mixed populations of WT and KO cells, with such images obtained from the four differently prepared specimens (for details, see Figure S16A). Box plots display the relative signal intensity values, with the arithmetic means marked by x, with the ones for the WT set to 100%, and with the SDs provided. Note that the mean TPR signal yield for the KO cells’ ZC3HC1-free NEs was only about half the WT cells’ corresponding value, largely irrespective of whether cells had been permeabilised before or after fixation or whether fluorescence stemmed from secondary IgGs or sdAbs. (B) Quantification of TPR signal yields at the NEs of WT and ZC3HC1 KO cells of HeLa, HCT116, U-2 OS, and hTCEpi. WT and ZC3HC1 KO cells co-cultured as mixed populations and harvested in G1 had been permeabilised with TX-100 after fixation, and immunolabelled for ZC3HC1 and TPR, with the latter then detected with fluorophore-conjugated, mouse IgG-specific sdAb. The dataset for HeLa represented an independent experiment distinct from the corresponding one presented in (A). Like for (A2), the mean TPR signal yield for the KO cells’ ZC3HC1-free NEs was only about half the WT cells’ corresponding value, with this applying to all the four cell lines. (C) IB of LNN materials obtained from WT cells of lines HeLa, HCT116, U-2 OS, and hTCEpi. Loading amounts had been adjusted for similarity of NUP107 signal intensities to facilitate comparability of the NE-associated amounts of TPR and ZC3HC1. Immunolabellings were on the membrane shown here and on a duplicate with identical loadings. The ZC3HC1-unrelated cross-reaction in the LNN materials of WT and KO cells of line hTCEpi, already addressed in Figure S15I, is marked by a double-asterisk. Note that amount relationships between TPR, NUP107, and ZC3HC1 were rather similar in the four different cell lines. As an aside, also note that the degree of post-translational modification of ZC3HC1 can differ between cell lines, with such modifications generally most pronounced in the LNN materials isolated from interphase and G0 populations of hTCEpi cells. (D) IB of LNN materials obtained from WT and ZC3HC1 KO cells of lines HeLa, HCT116, U-2 OS, and hTCEpi, harvested shortly before having reached confluency, in order to compare the relative amounts of NE-associated TPR in the ZC3HC1 KO versus WT cells for each cell type. Loadings for each cell line represented the same proportion of the WT and KO cells’ adjusted LNN materials (1 V), next to which half of this amount from the WT cells’ LNN fraction (0.5 V) was loaded as well. Immunolabelling was on the upper and lower parts of the membranes shown here and on identical duplicates. A double-asterisk again marks the ZC3HC1-unrelated cross-reaction in the LNN materials of hTCEpi. Note that for each cell line’s WT and KO cells, the signal intensity for NUP107 in the 1 V lanes, marked by arrow-tipped brackets in blue, was essentially the same. By contrast, TPR signal intensities in the LNN fractions of the ZC3HC1 KO cells amounted, at most, to only about half of the intensity in the corresponding WT cells’ fraction obtained from about the same number of cells. Accordingly, the signal intensities for TPR in the 1 V lanes of the KO cells of lines HeLa, HCT116, and hTCEpi were highly similar to those for TPR in the 0.5 V lanes of the corresponding WT cells, with such relationships marked by arrow-tipped horizontal brackets in dark green. In contrast, in the 1 V lane of the U-2 OS KO cells, the TPR signal intensity was slightly lower than in the WT cells’ 0.5 V lane, with this then marked by the double-headed curved arrow in lighter green.

