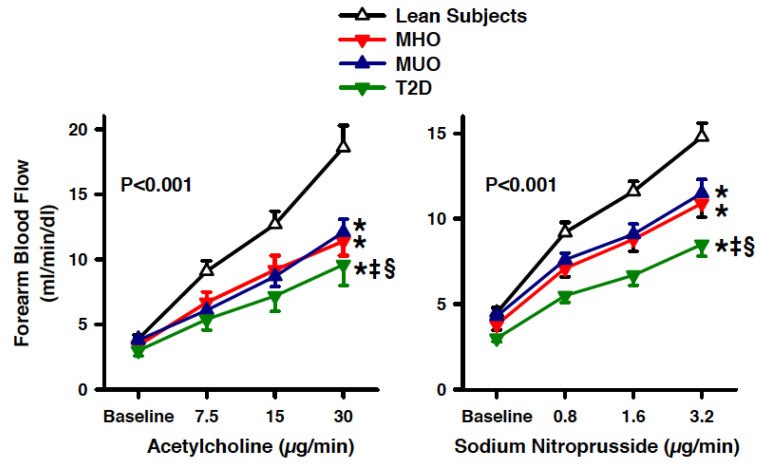
Figure 2.
Graphs showing the forearm blood flow responses to acetylcholine (left panel) and sodium nitroprusside (right panel) in lean subjects (open triangles), patients with metabolically healthy obesity (MHO, red triangles), patients with metabolically unhealthy obesity (MUO, blue triangles) and obese patients with type 2 diabetes (T2D, green triangles). The p values refer to the comparisons among the 4 groups by 2-way analysis of variance. All values are means ± SEM. * p < 0.05 vs. lean subjects, ‡ p > 0.05 vs. MHO and § p > 0.05 vs. MUO at the post hoc Holm–Sidak test for multiple comparisons.

