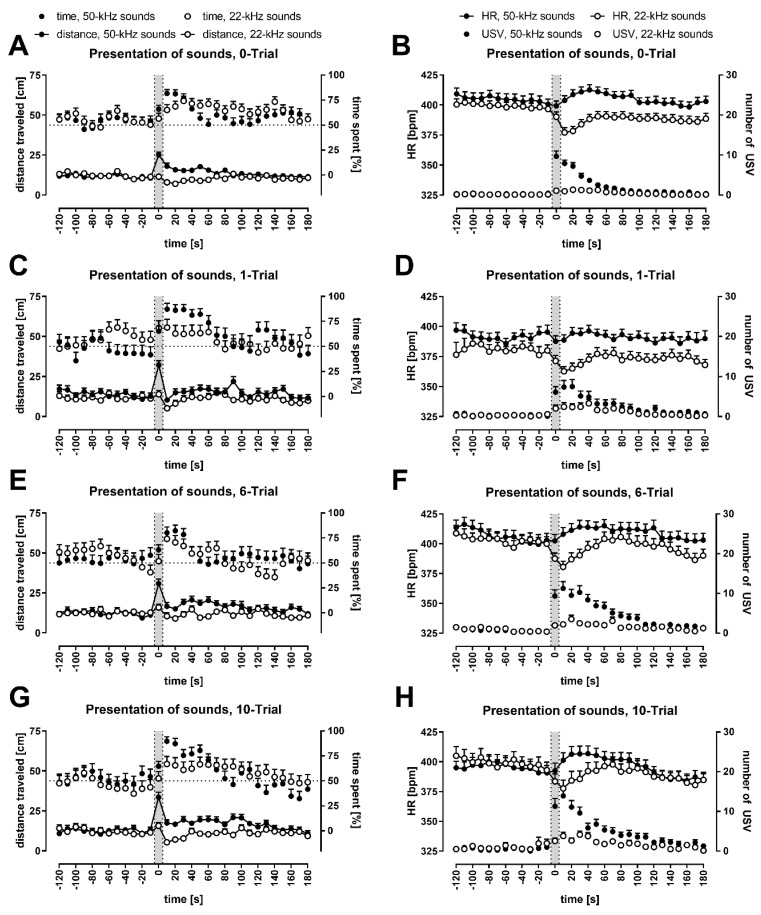
Figure 1.
Analysis of changes in distance traveled, time spent in the speaker’s half of the cage, heart rate (HR), and the number of emitted vocalizations during playback session in rats exposed to both 50-kHz- vs. 22-kHz playback, with averaged effects of natural and artificial sounds. Gray sections correspond to the 10-s-long ultrasonic presentation. Graphs depict responses after previous exposure to: no shock (A,B), one shock (C,D), six shocks (E,F), and ten shocks (G,H). In the left column (A,C,E,G), distance traveled is presented as connected dots (cm, left Y axis), percentage of time spent in the speaker’s cage half—as not connected dots (%, right Y axis). In the right column (B,D,F,H), HR is presented as connected dots (bpm; beats per minute, left Y axis); the number of USV is presented as not connected dots (right Y axis). Each point is a mean for a 10-s-long time-interval with SEM. The dotted horizontal line marks a 50% chance value for time in a side of the cage. Playback of 50-kHz sounds results in a rise of locomotor activity (the weakest in control rats), copious USV emissions and HR increase (the weakest in 1-Trial rats). Playback of 22-kHz sounds is followed by decrease in locomotor activity (the smallest in 0-Trial rats) and HR as well as modest increase in vocalization; groups: 0-Trial, n = 37; 1-Trial, n = 16; 6-Trial, n = 20; 10-Trial, n = 19.

