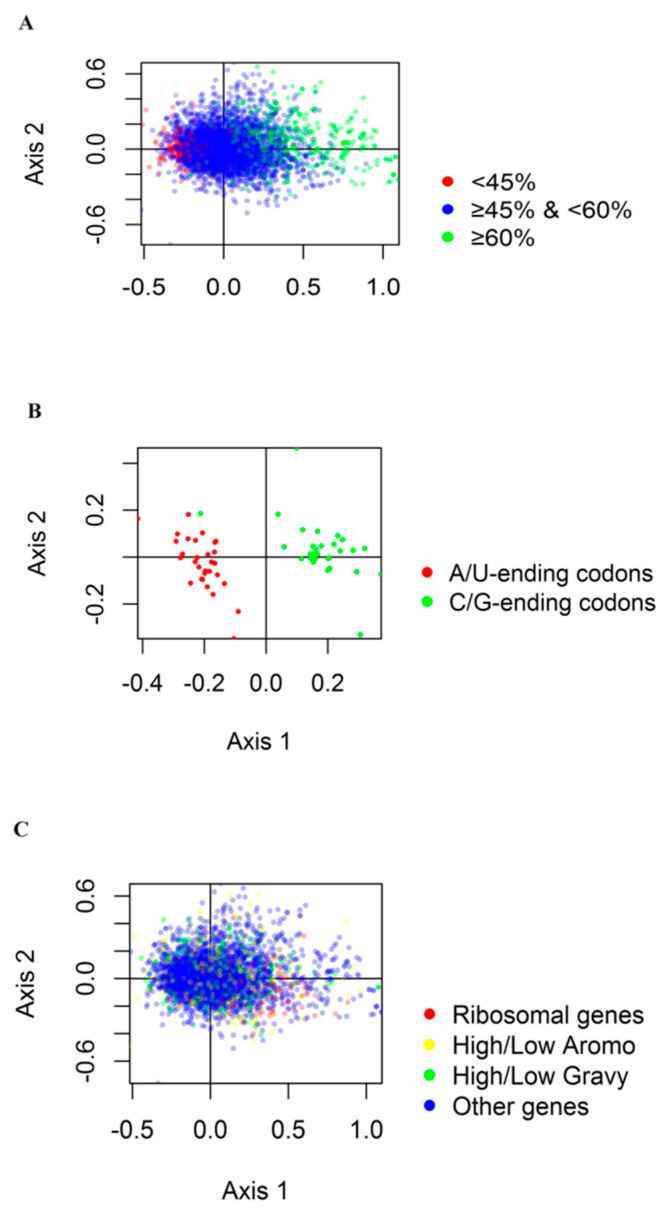
Figure 5.
Correspondence analysis of RSCU for G. duodenalis genes. (A). The first two axes show the distribution of G. duodenalis genes. Green dots represent G + C content ≥ 60%; Blue dots represent G + C content ≥ 45%, but less than 60%; Red dots represent G + C content ≤ 45%. (B). Panel A shows the distribution of codons on the same two axes. Red dots indicate A and T ending codons, and green dots indicate G and C ending codons. (C). Red dots represent ribosomal genes, yellow dots represent genes with an Aromo value ≥0.15, green dots represent genes with a Gravy value higher than 5, and blue dots represent other genes.

