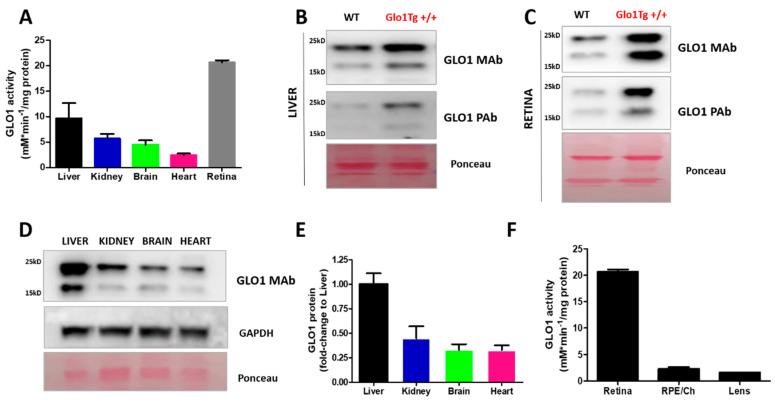
Figure 3.
A comparative analysis of GLO1 protein and activity in ocular and non-ocular tissues. (A) GLO1 activity was assayed in non-ocular tissues and retinal tissues from WT mice as previously described [29] and activity was expressed as percentage (%) compared to liver. (B) Liver and (C) retina representative Western blot analysis of WT and Glo1 overexpression transgenic mice (Glo1 Tg+/+) using a monoclonal antibody (non-commercial) and polyclonal antibody for Glo1 (commercial, GeneTex) [36,103,104]. (D) Representative Western blot analysis of non-ocular tissues extracts (50ug) of WT mice using a monoclonal antibody for Glo1 (non-commercial) and (E) protein quantification of GLO1 normalized to control loading (Ponceau staining). (F) GLO1 activity was performed in ocular tissues (Retina, RPE/Choroid, and Lens) from WT mice as previously described [29] and activity was expressed as milliunits per milligram of protein. Values are mean ± SEM. Sample size is n = 4 from the GLO1 protein and activity assays.

