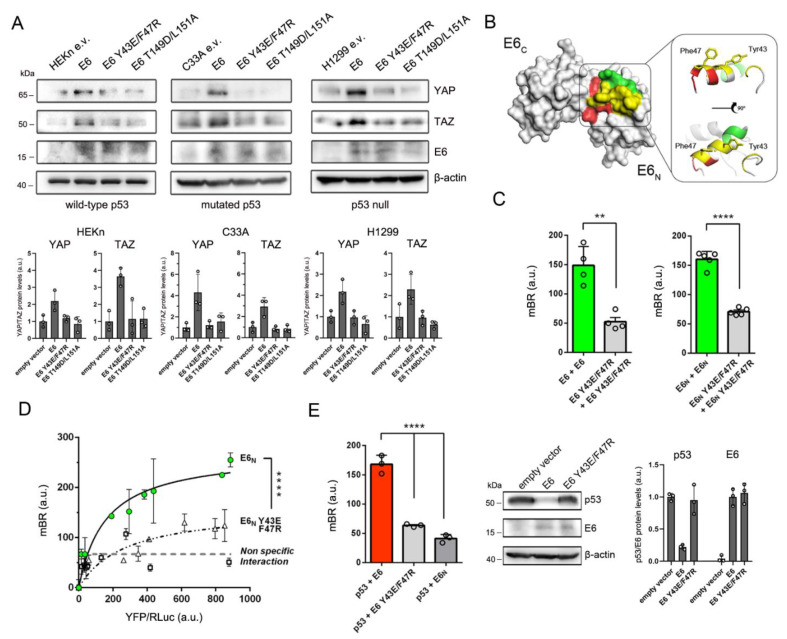
Figure 2.
HPV16 E6 forms dimers in the cell and its homodimerization is linked to YAP/TAZ upregulation. (A) Western blot analysis of three different cell lines cultivated at complete confluence (HEKn: neonatal human epidermal keratinocytes, bearing wild-type p53; C33A: HPV-negative cervical cancer cells, mutated p53; H1299: HPV-negative lung cancer cells, p53-null) showing endogenous YAP and TAZ accumulation only in the presence of wild-type E6 expression, independently of cellular p53-status. β-actin was used as a loading control. Bar graphs (bottom) show the relative densitometry quantifications of YAP/TAZ protein bands normalized to β-actin. Data are Mean ± SD of 3 independent experiments. The uncropped Western blots have been shown in Supplementary Materials. (B) Surface representation of E6 with residues of the α2 helix involved in E6 homodimerization (green), E6–p53 interaction (red) or both (yellow) highlighted according to published structural data [41,42]. Right panel shows the ribbon representation of the α2 helix and solvent-exposed Tyr43 and Phe47. E6N and E6C: N- and C-terminal domains. Model created with PyMOL (PDB code: 4xr8). (C) E6 homodimerization measured through BRET assays expressing RLuc- and YFP-tagged full-length E6 proteins (left graph) or E6N recombinant fragments (right graph) in HEK 293T cells. Data are Mean ± SD of ≥ 4 independent experiments performed in triplicate. ** p < 0.01, **** p < 0.0001 determined with unpaired two-tailed t tests. (D) BRET binding curves of the self-associations of RLuc- and YFP-tagged E6N (green circles) and E6N Y43E/F47R (white triangles) protein fragments expressed in HEK 293T cells. Black and dashed lines represent the non-linear regression binding curves of E6N (R2 = 0.937) and E6N Y43E/F47R (R2 = 0.836), respectively. The level of non-specific interaction (grey dashed line) represents the interaction signals (white squares) of E6N with an unrelated protein (UL44 of human cytomegalovirus). Data are Mean ± SEM of a representative experiment performed with triplicates. **** p < 0.0001 determined with extra sum-of-squares F test. (E) Left graph: E6–p53 interaction measured through BRET assays in HEK 293T cells. The E6N–p53 interaction was used as a negative control. Data are Mean ± SD of three independent experiments performed in triplicate. **** p < 0.0001 determined with one-way ANOVA with Dunnett’s multiple-comparisons test. Right panel: Western blot analysis of HEK 293T cells showing endogenous p53 levels following E6 or E6 Y43E/F47R overexpression. β-actin was used as a loading control. Bar graph shows relative densitometry quantifications of p53 and E6 protein bands normalized to β-actin. Data are Mean ± SD of 3 independent experiments. In (A,C–E), a.u.: arbitrary units.

