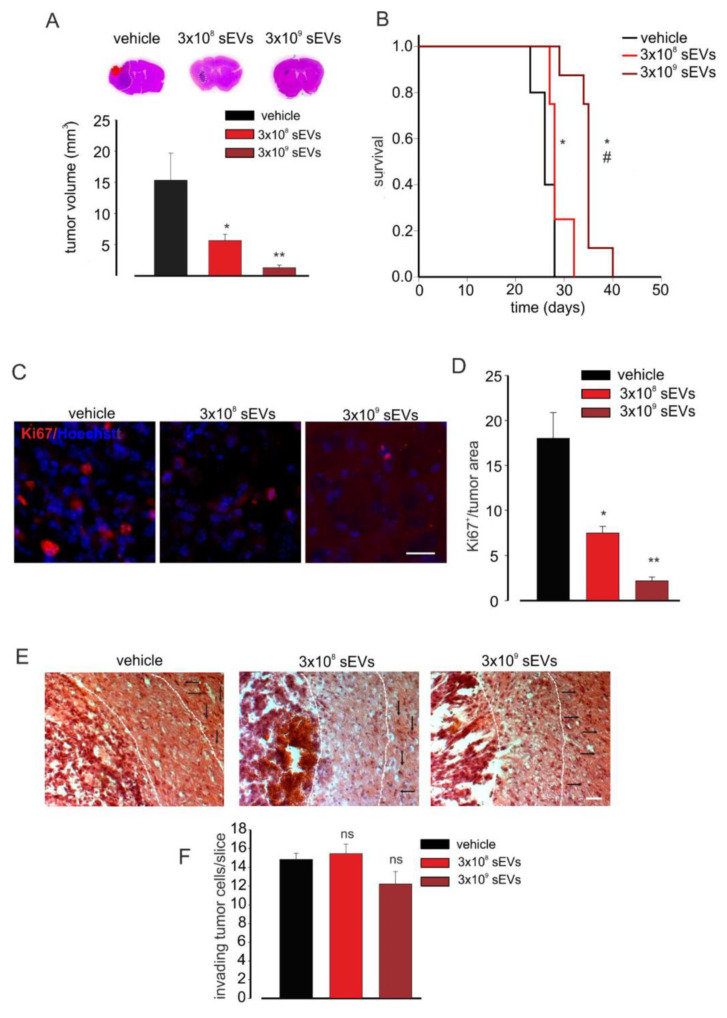
Figure 3.
Microglia-derived sEV effects on tumor size and survival in glioma-bearing mice. (A) Tumor size in the brain of GL261-bearing mice treated with a vehicle or 3 × 10⁸ or 3 × 10⁹ BV2-derived sEVs. Tumor size (in mm3) was reported as mean ± SE; N = 7 mice/experimental group in vehicle and 3 × 10⁸ groups and N = 6 mice/experimental group in 3 × 10⁹ group; * p < 0.05, ** p ≤ 0.001 vs. vehicle; by using Student’s t-test. On the top, representative coronal brain sections of GL261-bearing mice treated as above, stained with hematoxylin and eosin; the tumor area is indicated by the dashed line. (B) Kaplan–Meier survival curves of GL261-bearing mice treated with 3 × 10⁸ or 3 × 10⁹ BV2-derived sEVs obtained from 1 × 10⁶ or 1 × 10⁷ cells. N = 10 mice/experimental group in vehicle group and N = 8 mice/experimental group in 3 × 10⁹ and 3 × 10⁸ groups; Gehan-Breslow statistic for the survival curves (p < 0.001); multiple comparisons: * p ≤ 0.05 vs. vehicle, # p ≤ 0.05 3 × 10⁸ sEVs vs. 3 × 10⁹ sEVs; by using the Holm-Sidak test. (C) Representative immunofluorescence analysis for Ki67 (in red; Hoechst in blue) of coronal brain sections of GL261-bearing treated with a vehicle and 3 × 10⁸ and 3 × 10⁹ BV2-derived sEVs. Scale bar: 50 μm. (D) Quantification of (C). Data are expressed as mean intensity (Int) per tumor area ± SE; N = 3; * p ≤ 0.05, ** p ≤ 0.001 vs. vehicle; by using the Mann–Whitney test. (E) Representative brain peritumoral sections stained with haematoxylin/eosin of GL261-bearing mice treated with vehicle and 3 × 10⁸ and 3 × 10⁹ BV2-derived sEVs; white arrows indicate glioma cells invading the brain parenchyma beyond the main tumour border for more than 150 μm (dashed line); scale bars: 40 μm. (F) Quantification of (E). Data are expressed as mean cell number ± SE; N = 3/experimental group; ns p > 0.05 vs. vehicle; by using Student’s t-test.

