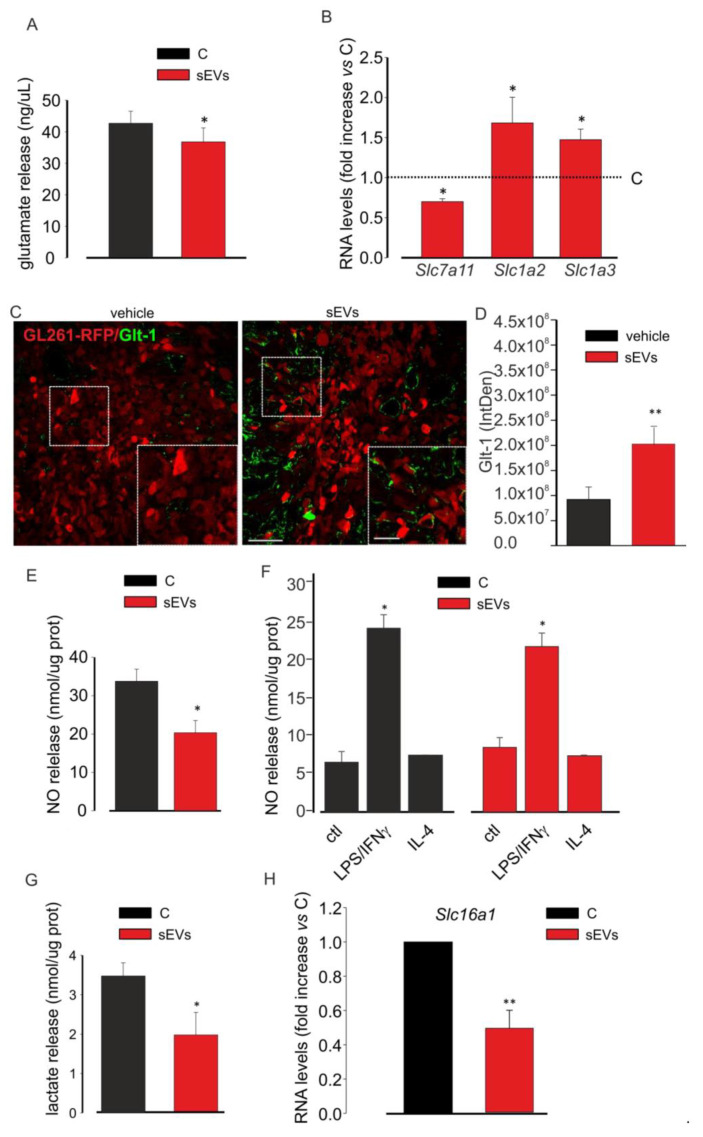
Figure 4.
Microglia-derived sEV effects on the toxicity of glioma cells. (A) Glutamate release in a medium of untreated (C) or BV2-derived sEVs-treated GL261 cells. Data are expressed as ng/mL; N = 3; * p < 0.05 vs. C; by using Student’s t-test. (B) qPCR of Slc7a11, Slc1a2, and Slc1a3 genes expressed in untreated (C) or BV2-derived sEVs-treated GL261 cells. Data are the mean ± SE of fold increase vs. C; normalized on Gapdh (used as a housekeeping gene); N = 6; * p < 0.05 vs. C; by using the Mann–Whitney rank sum test. (C) Representative immunofluorescence analysis for Glt-1 (in green; GL261-RFP in red) in the tumor core of coronal brain sections of GL261-bearing mice which were not treated (vehicle, on the left) or treated with BV2-derived sEVs (on the right); scale bars: 20 μm. In the inset, an enlargement is shown; scale bars: 50 μm. (D) Quantification of (C). Data are expressed as mean IntDen ± SE; N = 3; ** p ≤ 0.001 vs. vehicle; by using Student’s t-test. (E) NO release in the medium of untreated (C) or BV2-derived sEVs-treated GL261 cells. Data are expressed as nmol/mg prot; N = 3; * p < 0.05 vs. C; by using Student’s t-test. (F) NO release in the medium of untreated (ctl), LPS/IFNγ-treated, and IL 4-treated BV2 cells in absence (C) or in the presence of BV2-derived sEVs. Data are expressed as nmol/mg prot; N = 3; * p < 0.05 vs. ctl both in C and in sEVs; by using Student’s t-test. (G) Lactate release in the medium of untreated (C) or BV2-derived sEVs-treated GL261 cells. Data are expressed as nmol/mg prot; N = 4; * p < 0.05 vs. C, Student’s t-test. (H) qPCR of Slc16a1 gene expressed in untreated (C) or BV2-derived sEVs-treated GL261 cells. Data are the mean ± SE of fold increase vs. C, normalized on Gapdh (used as a housekeeping gene); N = 8; ** p ≤ 0.001; by using Student’s t-test.

