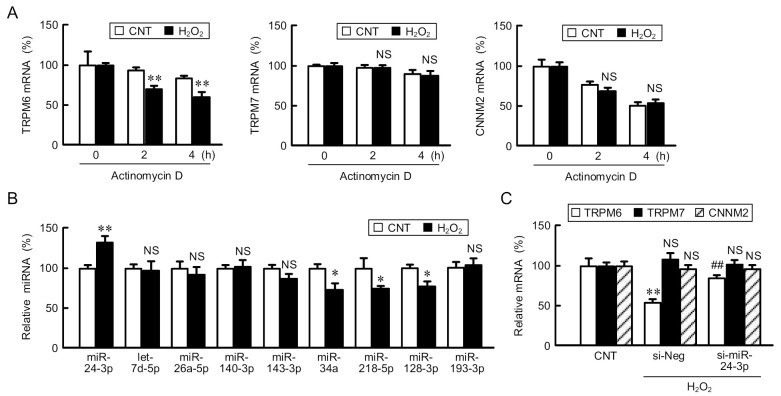
Figure 3.
Involvement of miR-24-3p in the decrease in TRPM6 mRNA by H2O2. (A) NRK-52E cells were treated with actinomycin D in the presence or absence (CNT) of H2O2 for the periods indicated. The mRNA levels of TRPM6, TRPM7, and CNNM2 were represented as percentage of 0 h. (B) Cells were treated in the presence or absence (CNT) of H2O2 for 6 h. The miRNA levels were determined by real time PCR and compared with CNT. (C) The cells transfected with negative (si-Neg) or miR-24-3p siRNA (si-miR-24-3p) were treated with H2O2 for 6 h. The mRNA levels of TRPM6, TRPM7, and CNNM2 were represented as percentage of CNT. n = 3–4. ** p < 0.01, * p < 0.05 and NS p > 0.05 compared with CNT or 0 μM. ## p < 0.01 compared with si-Neg.

