Figure 7.
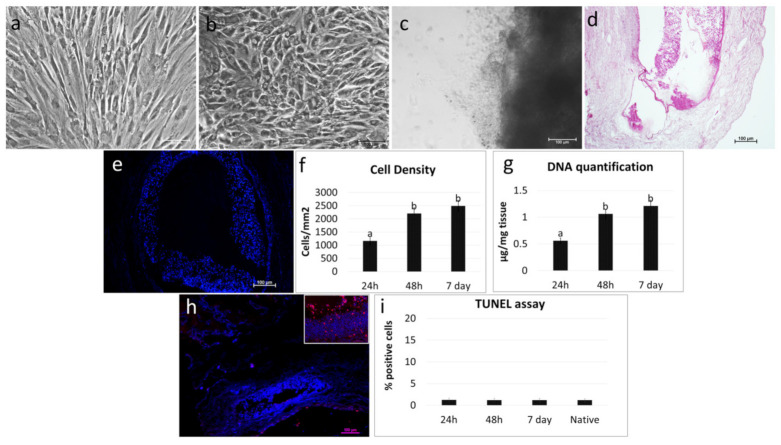
Repopulation of decellularized ovarian ECM-based scaffolds with hEpiE. (a) Representative image of human untreated fibroblasts showing the typical elongated shape. Scale bar = 100 μm. (b) After 18 h of exposure to 5-aza-CR, cells displayed a round epithelioid aspect and became smaller in size with larger nuclei and granular cytoplasm. Scale bar = 100 μm. (c) hEpiE adhered and migrated into the decellularized ECM-based ovarian scaffolds. Representative image after 7 days of culture. Scale bar = 100 μm. (d) H & E staining demonstrated the presence of hEpiE in the ECM-based scaffolds. Scale bar = 100 μm. (e) DAPI staining showed the positivity for nuclei. Scale bar = 100 μm. (f) Cell density analysis indicated ECM-based scaffolds’ repopulation after 24 h, with a higher number of cells after 48h and 7 days of coculture. Data are expressed as the mean ± the standard error of the mean (SEM). a and b indicate statistically significant differences (p < 0.05). (g) DNA quantification confirmed the presence of hEpiE in the ECM-based scaffolds after 24 h, with an increasing number of cells at 48h, which was steadily maintained at Day 7. Data are expressed as the mean ± the standard error of the mean (SEM). a and b indicate statistically significant differences (p < 0.05). (h) Representative picture of the TUNEL assay showing positive cells in red. Nuclei were stained with DAPI (blue). Scale bars = 100 μm and 50 μm. (i) TUNEL-positive cell rates detected 24–48 hours and 7 days after seeding were comparable to those identified in the native tissues (native). Data are expressed as the mean ± the standard error of the mean (SEM).

