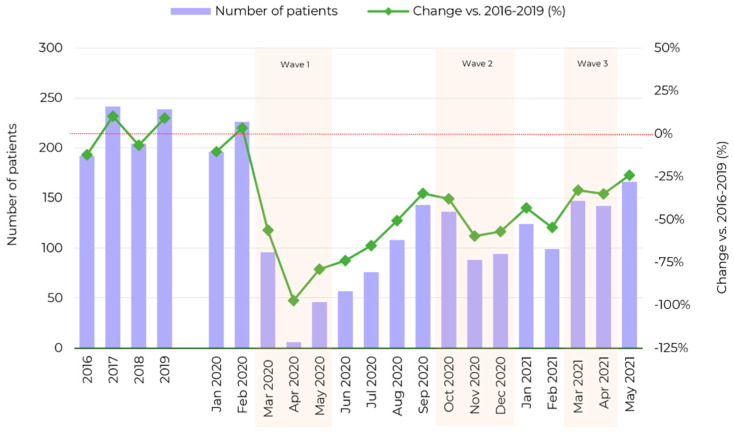
Figure 2.
Bar chart showing mean monthly numbers of patients undergoing elective cataract surgery performed during the analyzed periods. The reference level was calculated as a mean monthly number of cataract surgeries in 2016–2019 (raw data in Table S1).

