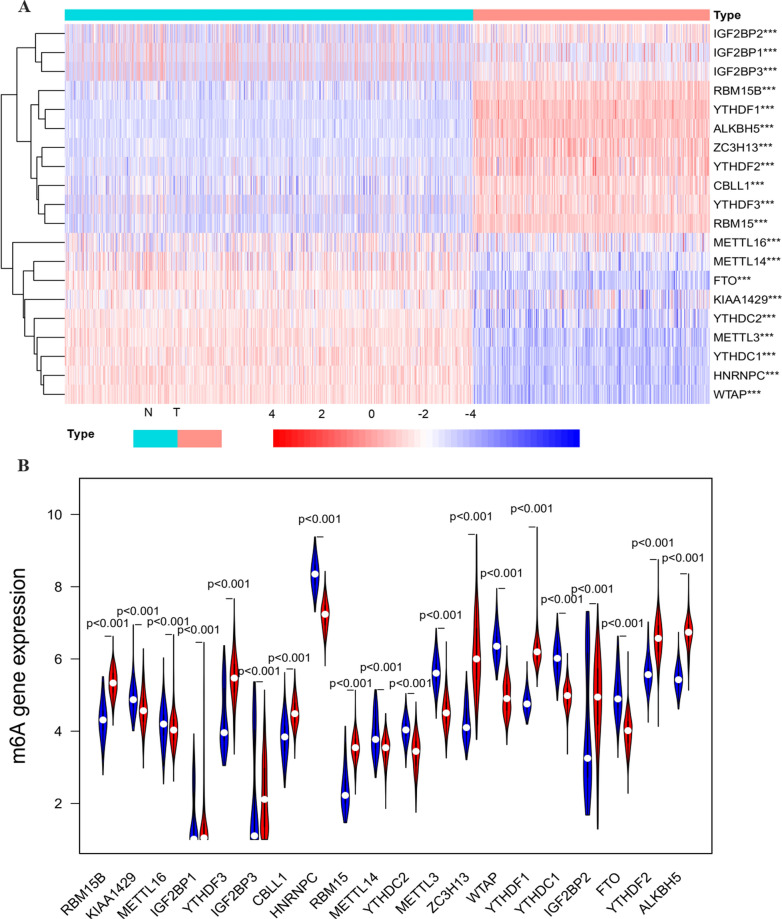
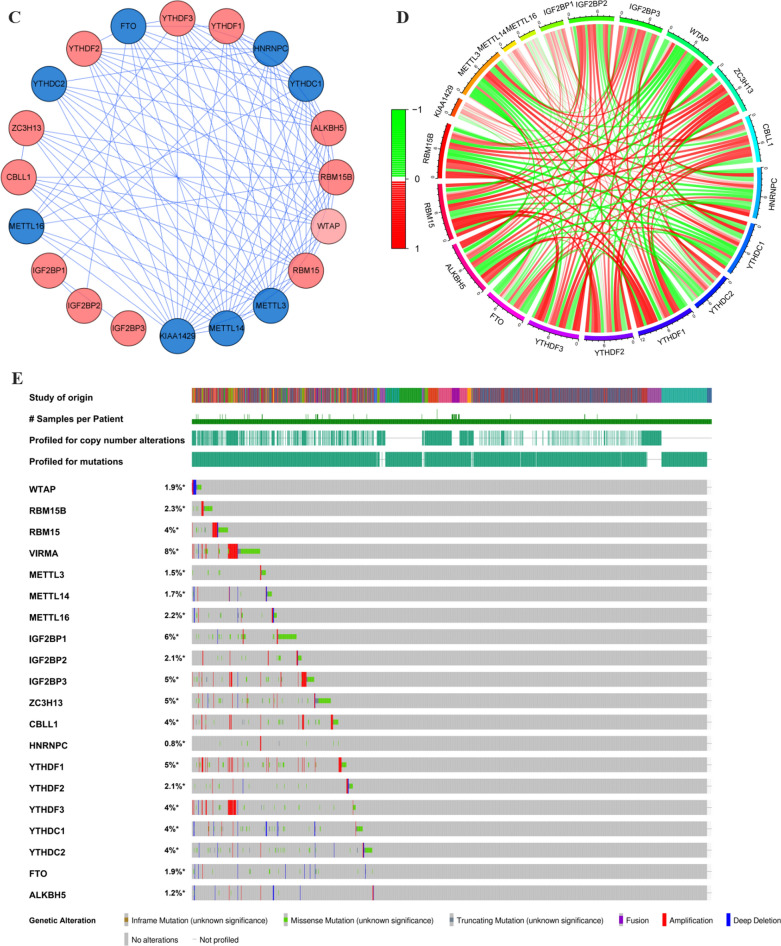
Fig. 2.
The expression pattern of m6A RNA methylation regulators in the TCGA melanoma cohort. A Heatmap visualizing the expression levels of m6A RNA methylation regulators in tumor samples and normal samples. B Vioplot visualizing the differentially expressed m6A RNA methylation regulators in TCGA. (*P < 0.05, **P < 0.01, ***P < 0.001). C The PPI network of the twenty selected m6A RNA methylation regulators. D The Pearson correlation analysis of the twenty selected m6A RNA methylation regulators in the TCGA melanoma cohort. E The gene mutation overview of twenty hub genes in the TCGA melanoma patients


