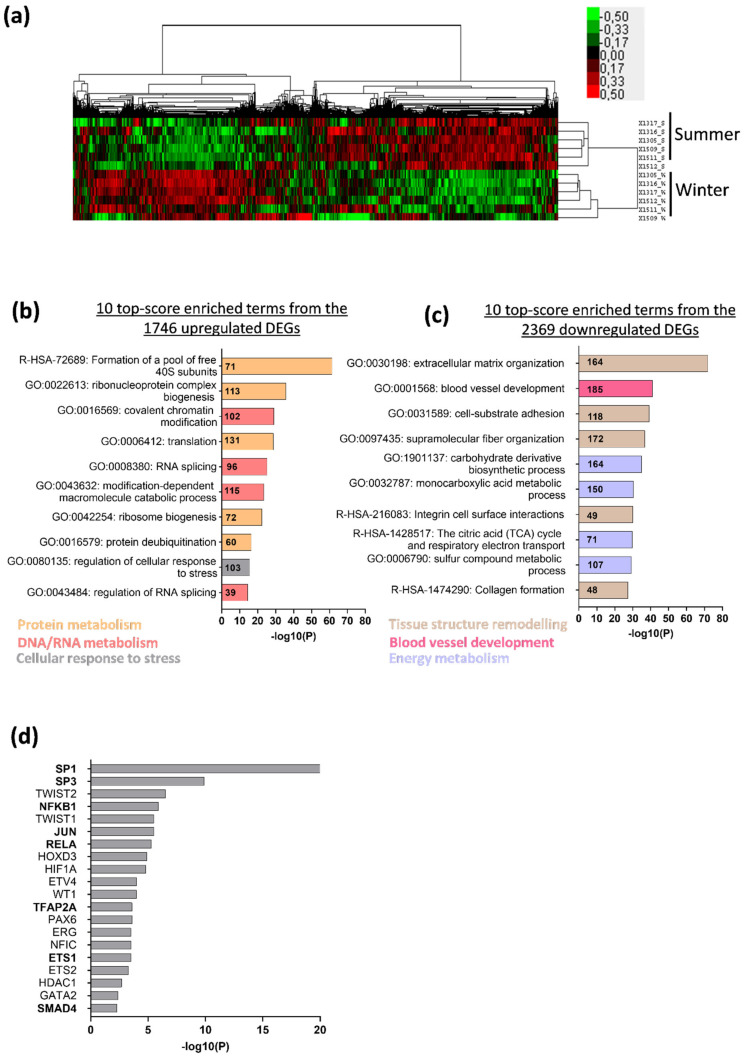
Figure 1.
Deep changes in brown bear muscle transcriptome during hibernation. (a) Heatmap from brown bear muscle (vastus lateralis) transcripts (n = 6 bears/season, the same individuals were sampled and analyzed in summer and winter); red indicates high and green indicates low expression level of the 13531 genes. (b) Graph representing the 10 top-score of significantly enriched terms in winter compared to summer, from the 1746 up-regulated differentially expressed genes (DEGs) (FC W/S >|1.3| and padj < |0.01|) or (c) from the 2369 down-regulated DEGs (FC W/S < |0.77| and padj < |0.01|; Table S1). The color code for the functional cluster is indicated in the respective graphs, and the bold numbers in the different bars represent the numbers of DEGs found in the enriched terms. (d) Graph representing the 10 top-score of transcription factors involved in DEGs regulation from “Formation of a pool of free 40S subunits” and “Extracellular matrix organization” enriched terms. The bold TFs are involved in TGF-β superfamily regulation.

