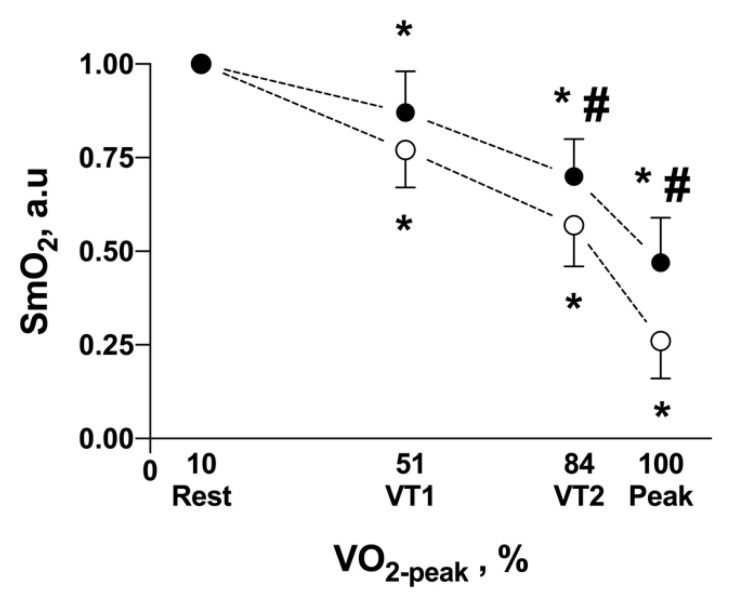
Figure 5.
Oxygen saturation (SmO2) in respiratory (m.intercostales, solid circles) and locomotor muscles (m.vastus laterallis, hollow circles) in the triphasic model of exercise intensity. Values are expressed as an arbitrary unit (a.u). * p < 0.05 respect to rest-phase; # p < 0.05 comparison between muscles.

