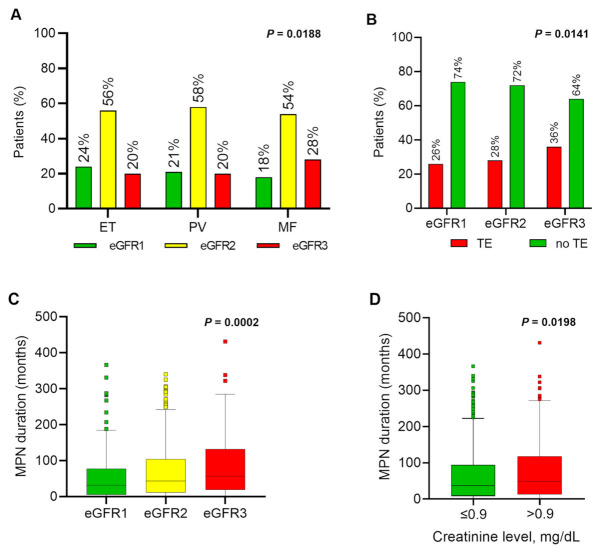
Figure 1.
Distribution of kidney dysfunction, thrombosis, and MPN duration across all patients (pts; n = 1420). (A) Distribution (%) of kidney function groups eGFR1 (≥90 mL/min/1.73 m2), eGFR2 (60–89 mL/min/1.73 m2), or eGFR3 (<60 mL/min/1.73 m2) across the MPN subtypes ET, PV, and MF; (B) Percentage of pts with (yes) or without (no) a history of thromboembolic events (“thrombosis”) among the eGFR1,2,3 groups; (C) MPN duration in months from diagnosis to renal function assessment in the eGFR1,2,3 groups. In addition, median MPN duration is indicated for each eGFR group; (D) MPN duration in months from diagnosis to renal function assessment in the group of patients with a creatinine level at or below the median (≤0.9 mg/dL) or above the median (>0.9 mg/dL). In addition, median MPN duration is indicated for both groups. * Wilcoxon–Mann–Whitney test.

