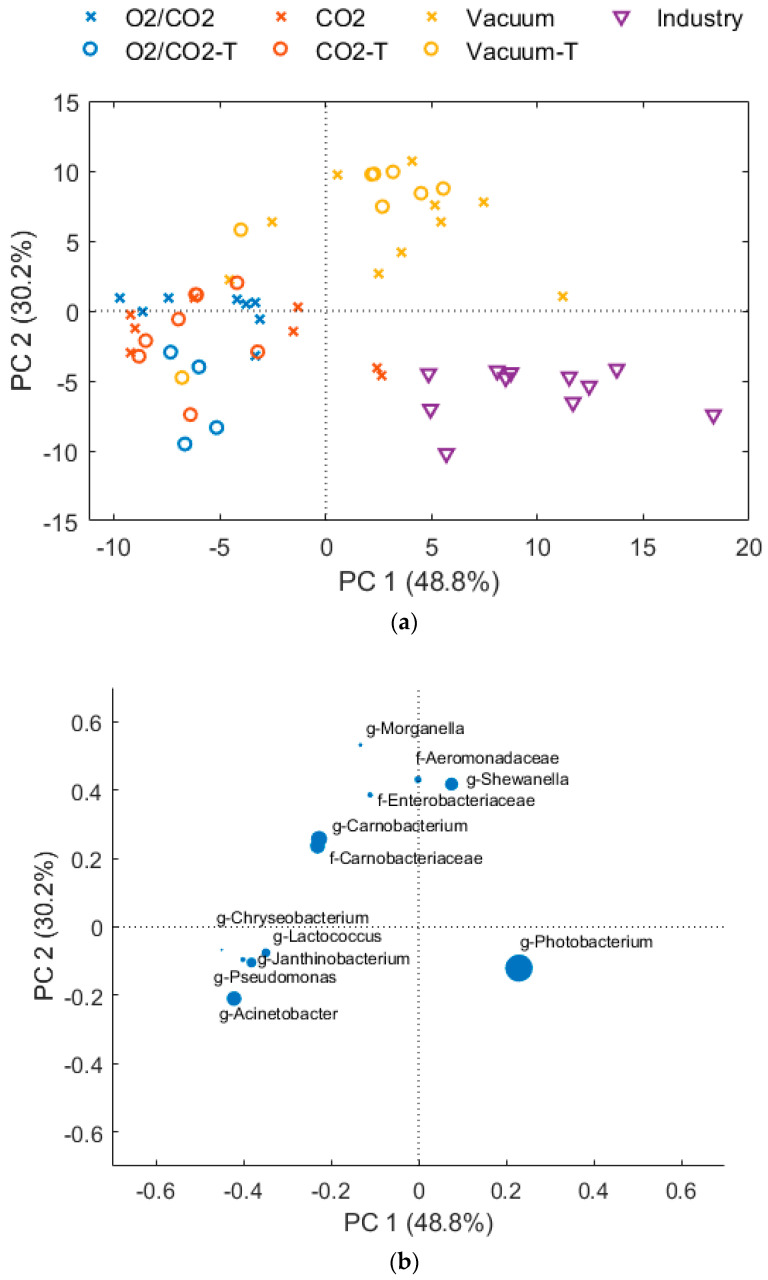
Figure 4.
PCA of bacteriota after 1, 5, 8, 13 and 15 days of storage of fresh (cross symbol) and thawed (circle symbol) samples. The “CO2” samples (red color) are packaged with 60% CO2, 40% N2 and a CO2 emitter, and “O2/CO2” (blue color) is packaged with 60% CO2 and 40% O2. “Industry” samples (purple triangle symbol) and “Vacuum” samples (yellow color) are packaged with vacuum. (a) Scores plot, days of storage are indicated by label, (b) loading plot, dot size corresponds to relative abundance.

