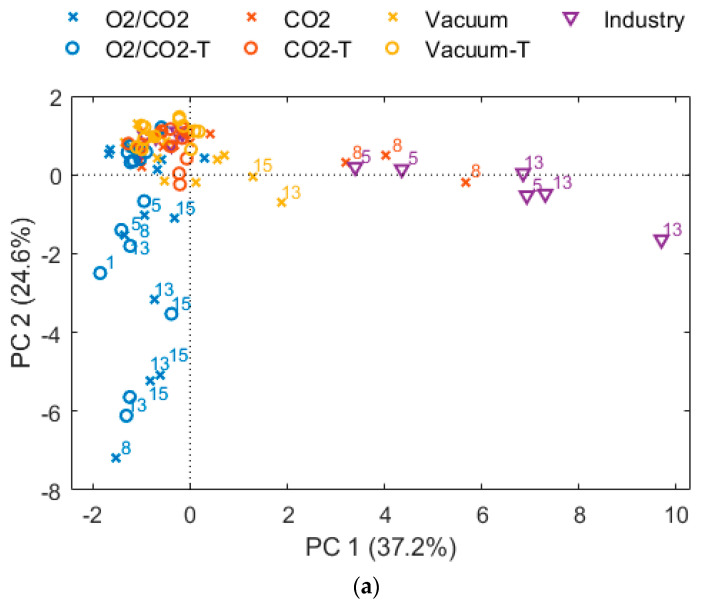
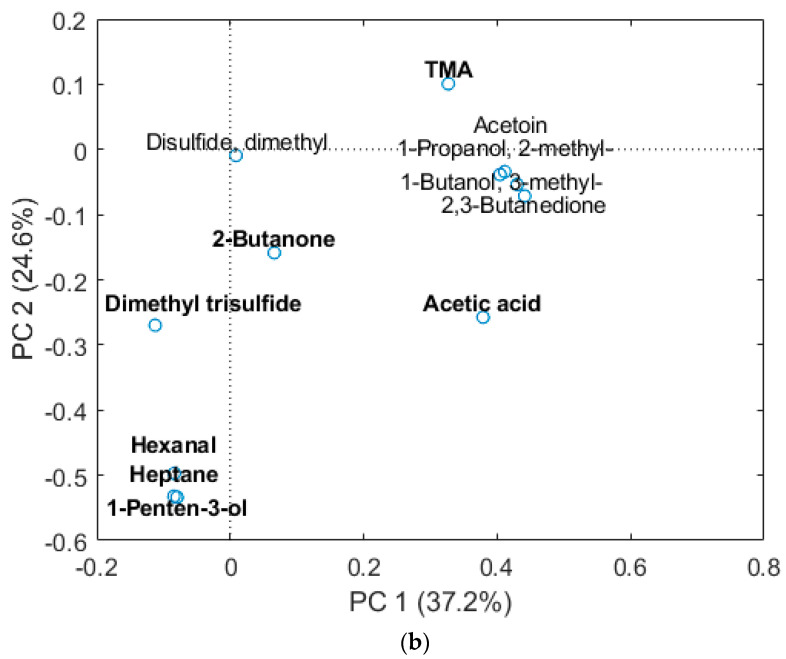
Figure 6.
PCA of volatile components after 8 and 13 days of storage for fresh (cross symbol) and thawed (circle symbol) samples, Table 2. samples (red color) are packaged with 60% CO2, 40% N2 and a CO2 emitter, and “O2/CO2” (blue color) is packaged with 60% CO2 and 40% O2. “Industry” samples (purple triangle symbol) and “Vacuum” samples (yellow color) are packaged with vacuum. (a) Score plot and (b) loading plot. Days of storage are indicated by label for those with score PC1 > 1 or score PC2 < 1. Loading plot: Compounds with significant effect of packaging gas (FDR < 0.05) from the 5050 manova/rotation test for design samples are in bold letters.


