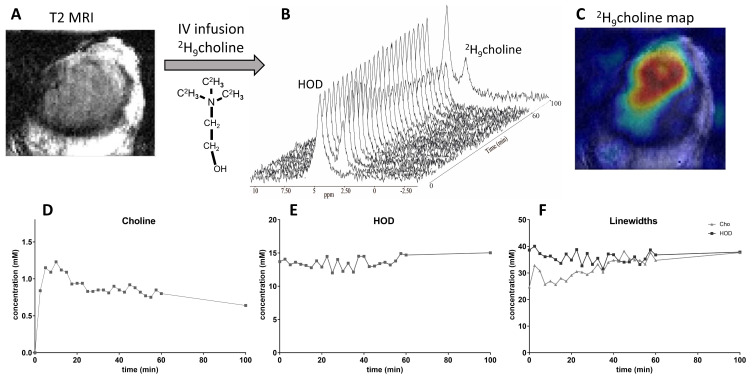
Figure 1.
Deuterium MR of a human renal tumor (SKRC17T) subcutaneously grown in a BALB/c mouse. (A). T2 MRI of the tumor. The chemical structure of [2H9]choline is also indicated. (B). Unlocalized 2H MR spectra obtained with a surface coil at a time resolution of 2:30 min. The first spectrum recorded before the infusion of choline only shows a natural abundance HOD signal at 4.8 ppm. Immediately after the infusion of a bolus of about 0.2 mL with [2H9]choline, a signal for this compound is observed at about 3.2 ppm. Within ~5 min after the infusion this signal has reached its maximum value and then slowly declines over time. (C). A metabolic map of [2H9]choline reconstructed from a high resolution DMI obtained between 60 and 100 min post-infusion. (D). [2H9]choline tissue concentration (mM) as a function of time post-infusion. After a rapid initial increase, it slowly decreases over time. (E). HOD tissue concentration (mM) as a function of time. Over the measurement period of 100 min the HOD concentration essentially remains constant. (F). Fitted linewidths (Hz) of the [2H9]choline and HOD resonances as a function of time. That of HOD essentially remains constant, while that of [2H9]choline increases.

