Figure 2.
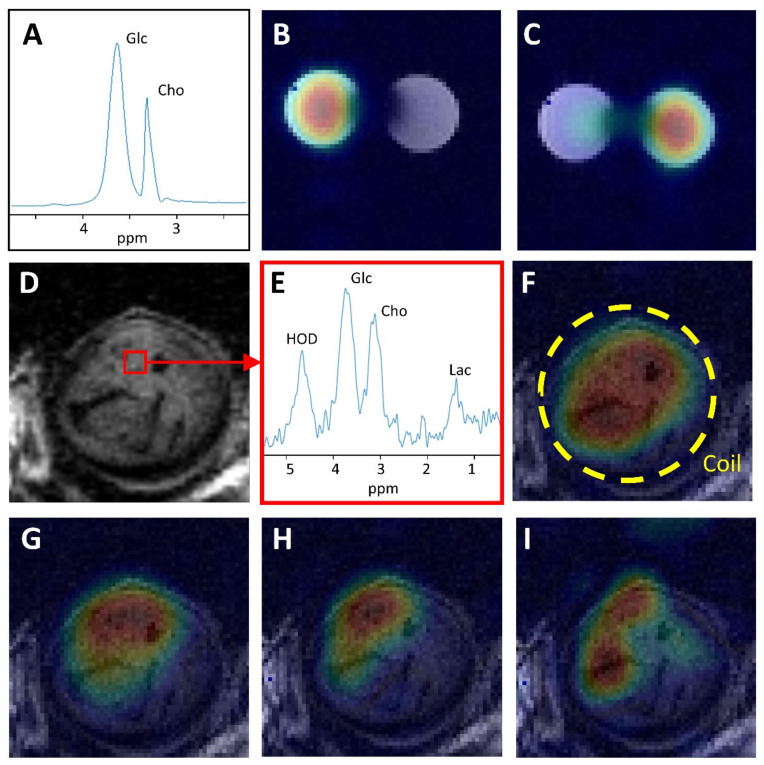
Deuterium metabolic imaging study of deuterated glucose and choline in phantom and in a human renal tumor subcutaneously growing in mice. (A). An unlocalized 2H MR spectrum of two tubes, one filled with a saline solution of 2H9 choline (63 mM) and the other with a saline solution of [6,6′-2H2]glucose (0.71 M). The glucose signal is completely separated from the choline signal. (B). [6.6′-2H2]glucose map reconstructed from high resolution DMI of both tubes. (C). [2H9]choline map reconstructed from high resolution DMI of both tubes. (D). T2 weighted MR image of a slice through a NU12 renal carcinoma growing in the flank of an NSG mouse. A voxel of 8 µL is indicated, which was selected from a high resolution 3D DMI recorded in 37 min after IV application of a mixture of [6,6′-2H2]glucose and [2H9]choline. (E). The 2H MR spectrum of the 8 µL voxel selected from the tumor shows signals for water (HOD), glucose (Glc), choline (Cho) and lactate (Lac). The spectrum was filtered with a 2Hz exponential line broadening. The glucose and choline signals are clearly separated. (F). HOD map reconstructed from 3D DMI. (G). Glucose map reconstructed from 3D DMI. (H). Choline map reconstructed from 3D DMI. (I). Lactate map reconstructed from 3D DMI. The maps are oriented parallel to the 2H RF coil (indicated by a circle in F) and projected on top of T1 MR images. The metabolic color maps were scaled to the highest intensity of the corresponding metabolite signal.

