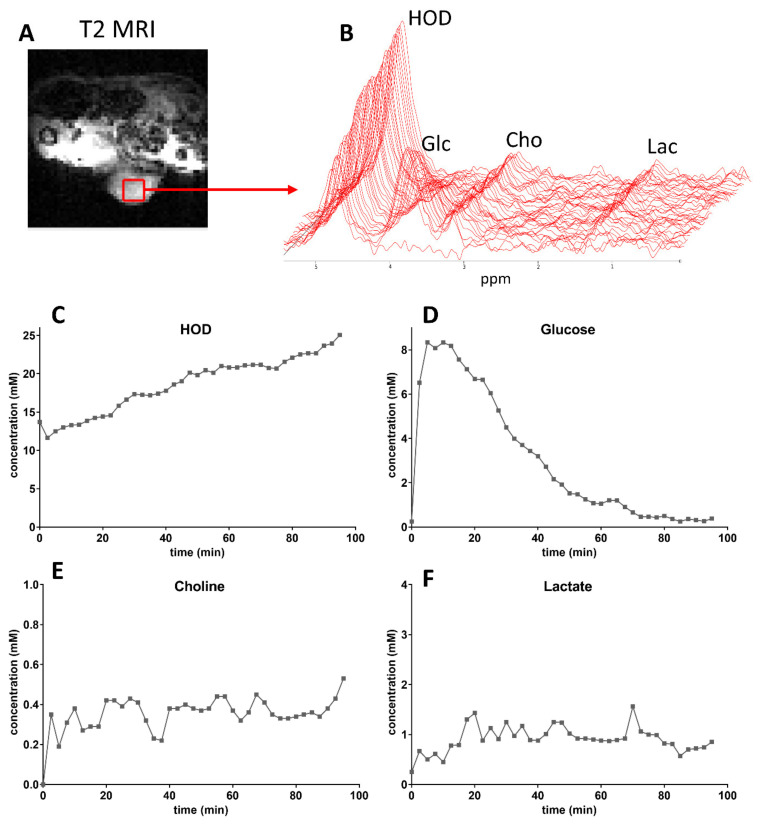
Figure 3.
Low spatial resolution 3D DMI (50 µL voxels), recorded at a time resolution of 2:24 min, from an SKRC 17T-CA9-Luc tumor growing in the flank of a mouse. (A). T2 weighted MRI with a selected voxel inside the tumor indicated by a red box. (B). Time series of 2H MR spectra consecutively recorded from this voxel over a period of 90 min showing an increasing HOD signal, an increasing and decreasing glucose signal (C,D), a rapidly increasing and then constant choline signal and a signal for lactate appearing during the decline of the glucose signal. (E,F). Time curves of metabolite tissue concentrations (mM).

