Figure 1.
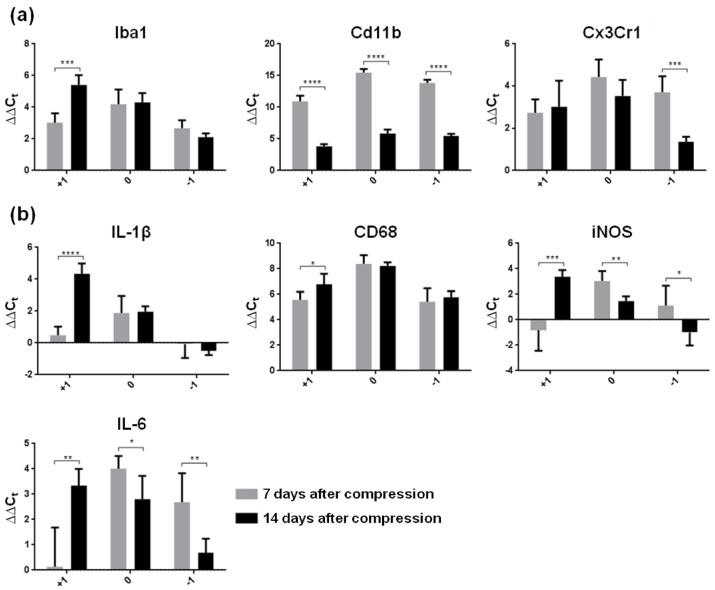
Gene expression of reactive microglial markers in spinal cord segments (0—lesion site, +1 cranially, −1 caudally) one and two weeks after Th9 compression. (a) Microglia/macrophage markers (Iba1, Cd11b, Cx3Cr1), (b) markers representing M1 phenotype of reactive microglia showing inflammation (IL-1β, CD68, IL-6) and oxidative stress (iNOS). Data are mean values of five experiments ±SD. The mRNA levels for each marker were normalized to the mRNA levels of 18sRNA and expressed as ∆∆Ct values relative to controls. Results were statistically evaluated using unpaired t-test; * p ˂ 0.05; ** p ˂ 0.01; *** p ˂ 0.001; **** p ˂ 0.0001. Iba1—ionized calcium-binding adaptor molecule 1; Cd11b—beta-integrin marker of microglia; Cx3Cr1—fractalkine receptor; IL-1β—interleukin-1β; CD68—cluster of differentiation 68; iNOS—inducible nitric oxide synthase, IL-6—interleukin-6.

